


Image Source: Unsplash
CSX Corp., Elliott Wave Technical Analysis
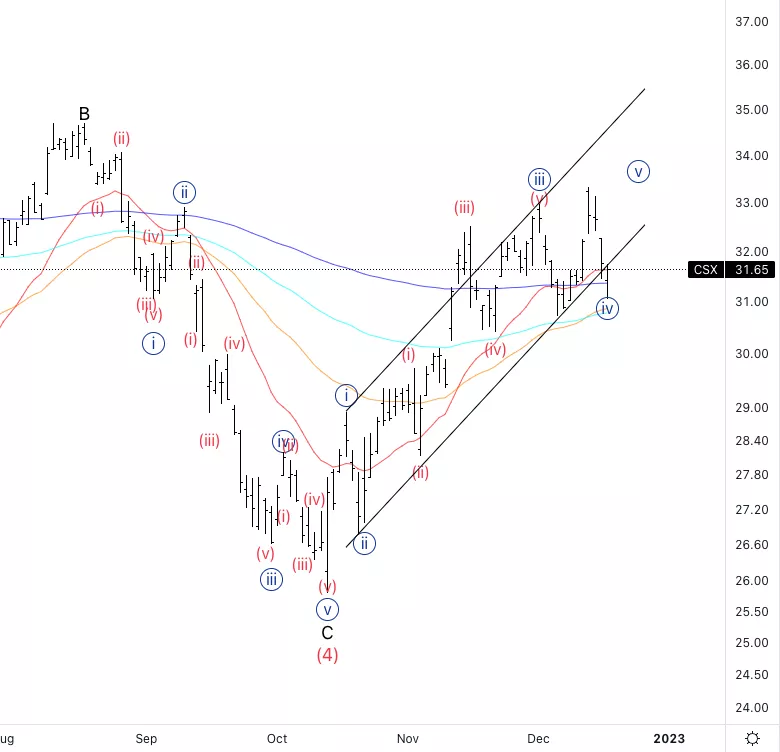
CSX Corp., (Nasdaq: CSX): Daily Chart, December 19, 2022,
CSX Stock Market Analysis: We are looking for a further continuation to the upside here on CSXhas we are facing support off the parallel trend channel as well as the moving averages. In addition, we have an alternation between a sharp wave {ii} and a sideways wave {iv} which provides additional confluence to the overall count.
CSX Elliott Wave Count: Wave {iv} of 1.
CSX Technical Indicators:20 and 200EMAs as support.
CSX Trading Strategy: Looking for longs into wave {v}
Analyst: Alessio Barretta
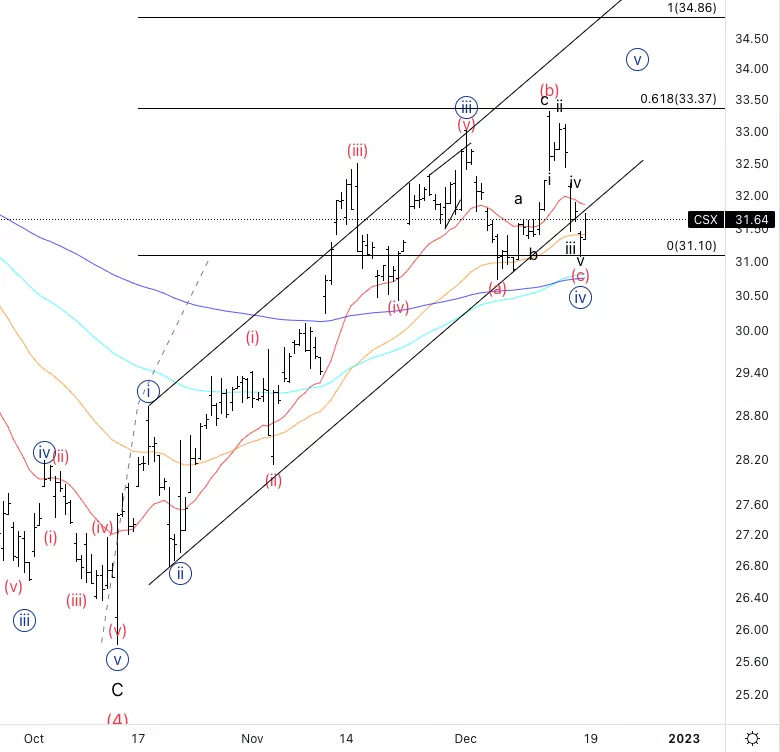
CSX Corp., CSX:4-hour Chart, December 19, 2022
CSX Corp., Elliott Wave Technical Analysis
CSX Stock Market Analysis: Looking for wave (c) to be potentially completed as we can see a clear five wave move to the downside.
CSX Elliott Wave count: Wave (c) of {iv}.
CSX Technical Indicators: In between averages.
CSX Trading Strategy: Looking for longs once we start to break the previous market structure.
More By This Author:
Cardano / U.S.dollar(ADAUSD) Elliott Wave Technical Analysis 19 December 2022
European Stock Market Elliott Wave Analysis
SP500, NASDAQ 100, Russell 2000, DJI. Elliott Wave Trading



Comments
Log in or sign up to join the conversation.