


Image Source: Unsplash
Broadcom Inc., Elliott Wave Technical Analysis
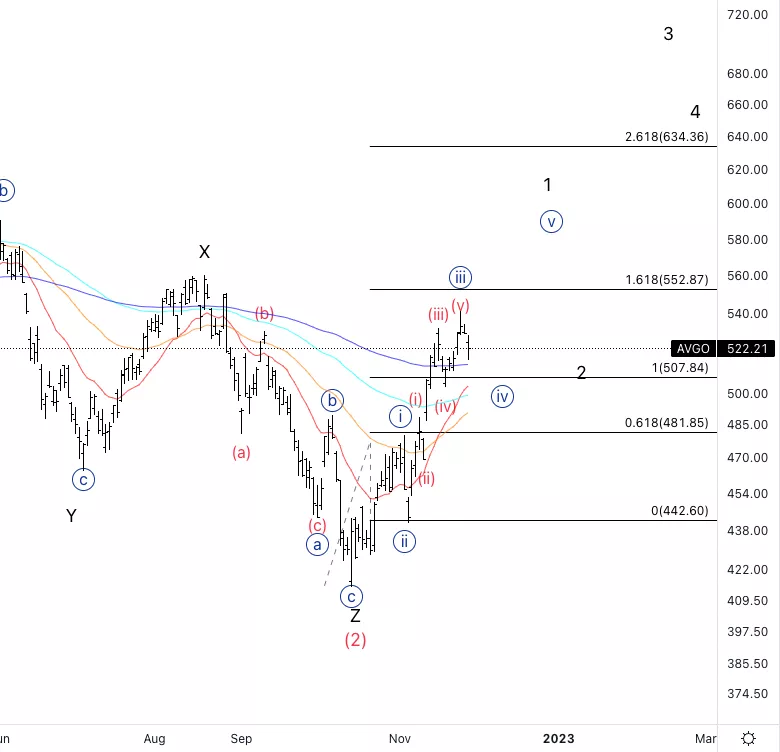
Broadcom Inc., (Nasdaq: AVGO): Daily Chart, November 29, 2022,
AVGO Stock Market Analysis: We have been moving as expected for the past weeks. We are now looking at a potential wave {iv} after we fell short of 1.618 {iii} vs. {i}.
AVGO Elliott Wave Count: Wave (a) of {iv}.
AVGO Technical Indicators: Getting closer to the 200EMA which may act as support.
AVGO Trading Strategy: Looking for further upside after wave {iv}.
Analyst: Alessio Barretta
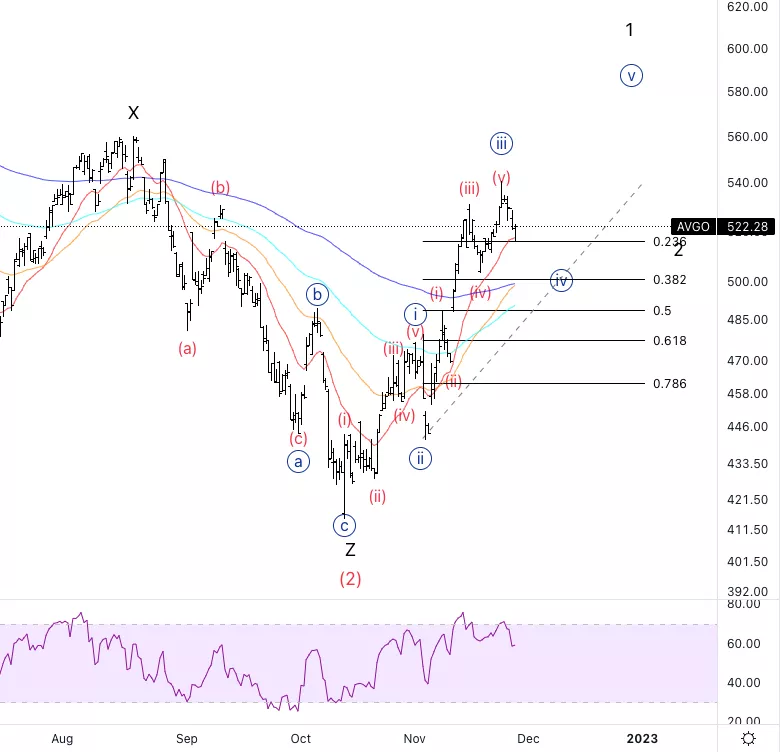
Broadcom Inc., AVGO: 4-hour Chart, November 29, 2022
Broadcom Inc., Elliott Wave Technical Analysis
AVGO Stock Market Analysis: We have a nice and clear five-wave sequence within wave {iii}and we are expecting wave {iv} to fall near wave four of one lesser degree at around 505$.
AVGO Elliott Wave count: Wave (a) of {iv}.
AVGO Technical Indicators: 20EMA acting as support.
AVGO Trading Strategy: Looking for wave {iv} to complete, you could look for very quick shorts on the way down wave (c).
More By This Author:
Elliott Wave Top In Place: S&P 500 - Nasdaq - Russell 2000 - Dow Jones
U.S. Dollar and StocksElliott Wave Analysis
Elliott Wave Technical Analysis: Analog Devices Inc. - Monday, Nov. 28



Comments
Log in or sign up to join the conversation.