


Image Source: Unsplash
BroadCom Inc., Elliott Wave Technical Analysis
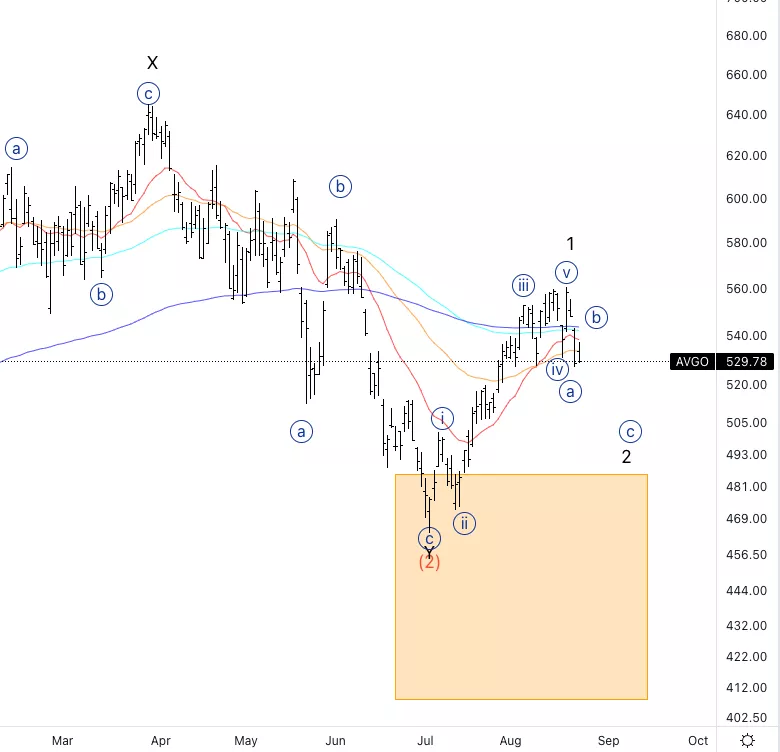
Broadcom Inc., (Nasdaq: AVGO): Daily Chart, August 24, 2022,
AVGO Stock Market Analysis: We could have a five-wave move to the upside just completed. Looking for further downside to complete wave 2 before looking for longs.
AVGO Elliott Wave count: Wave {a} of 2
AVGO Trading Strategy: Waiting for the completion of wave 2 to enter longs.
AVGO Technical Indicators: We are at a point where all the averages are crossing each other which would make us think about further downside to come as predicted.
Analyst: Alessio Barretta
BroadCom Inc., AVGO: 4-hour Chart, August 24, 2022,
BroadCom Inc., Elliott Wave Technical Analysis
AVGO Stock Market Analysis: Looking for a bounce in wave {b} to then resume lower.
AVGO Elliott Wave count: Wave {a} of 2.
AVGO Technical Indicators: Indicators suggest that upside is not ready to resume.
AVGO Trading Strategy: For short-term trading, we could wait for wave {b} and try to look for shorts into wave {c} of 2.
More By This Author:
SP500 Elliott Wave Analysis: Wave V) Of A - Protect Profits Trailing Stops
Elliott Wave Technical Analysis: Binance Coin
Nvidia - Elliott Wave Technical Analysis For Aug. 23



Comments
Log in or sign up to join the conversation.