

Block Inc., Elliott Wave Technical Analysis
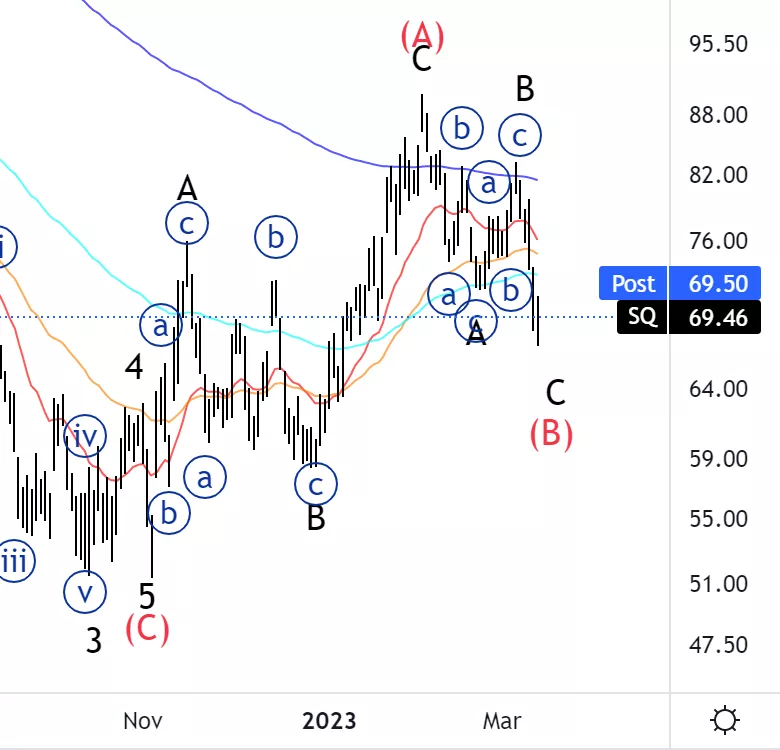
Block Inc.,(Nasdaq: SQ): Daily Chart, 14 March 2023.
SQ Stock Market Analysis: It looks like after a three wave move in what could have been wave (A) we could be near the end of another three wave move in wave (B), therefore we could expect an upside soon.
SQ Elliott Wave Count: Wave C of (B).
SQ Technical Indicators: Below averages.
SQ Trading Strategy: Looking for a bottom in wave (B).
Analyst: Alessio Barretta
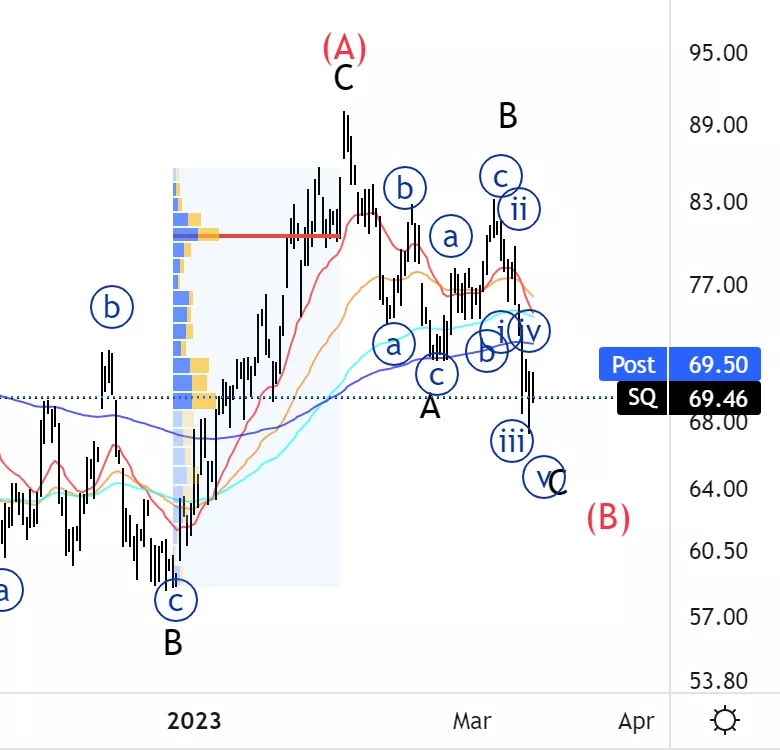
Block Inc., SQ: 4-hour Chart, 14 March 2023.
Block Inc., Elliott Wave Technical Analysis
SQ Stock Market Analysis: As shown in the chart we can identify a five wave structure into wave C which could signal the down move is completed. However, we do need further confirmation first.
SQ Elliott Wave count: Wave {v} of C.
SQ Technical Indicators: Below all averages, at a volume POC.
SQ Trading Strategy: Looking for a bottom in wave (B).
More By This Author:
Elliott Wave Technical Analysis: 10x Genomics
Elliott Wave Technical Analysis: Bitcoin, Monday, March 13
Elliott Wave Technical Analysis: Shopify Inc.


Comments
Log in or sign up to join the conversation.