
Elliott Wave Analysis TradingLounge Daily Chart, Tuesday, March 7,

Bitcoin/U.S. Dollar (BITCOMP)
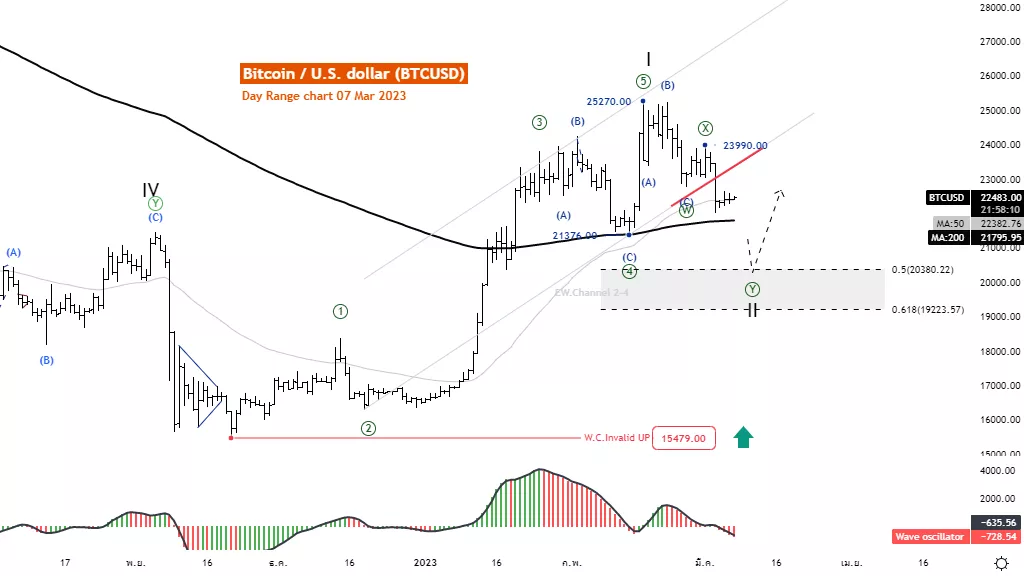
BTCUSD Elliott Wave Technical Analysis
Function: Follow trend
Mode: Motive
Structure: Impulse
Position: Wave ((5))
Direction Next higher Degrees: wave I of Motive
Details: Wave ((5)) tends to end at 25270 and the break of the parallel channel below. support this idea
Wave Cancel invalid level: 15479
Bitcoin/U.S. dollar (BTCUSD)Trading Strategy: Bitcoin is likely to end at 25270 as the price breaks the lower parallel channel support this idea This leads us to expect a reversal in the second wave. Usually reversed 50 or 61.8 of the first wave. So wait for the second wave to finish to join the trend again.
Bitcoin/U.S. dollar (BTCUSD)Technical Indicators: The price is above the MA200 indicating an uptrend. The wave oscillators below Zero-Line momentum are bearish.
TradingLounge Analyst: Kittiampon Somboonsod
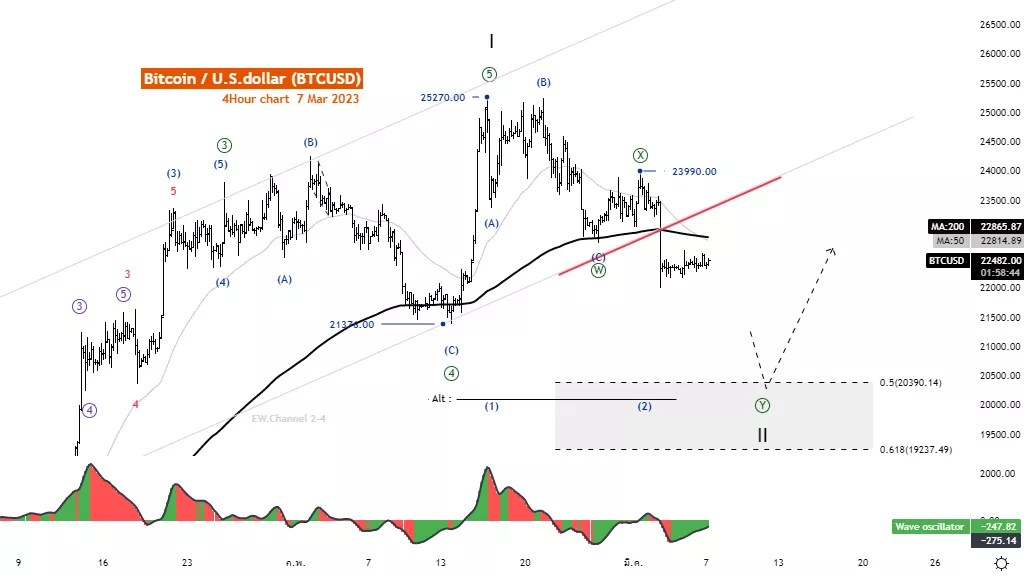
Elliott Wave Analysis TradingLounge 4H Chart, Tuesday, March 7.
Bitcoin/U.S. Dollar (BTCUSD)
LINKUSD Elliott Wave Technical Analysis
Function: Counter trend
Mode: Corrective
Structure: Flat
Position: Wave (C)
Direction Next higher Degrees: Wave ((2)) of Motive
Details: Retracement of wave ((2)) usually .50 or .618 x Length wave ((1))
Wave Cancel invalid Level: 5.386
Bitcoin/U.S. Dollar (BTCUSD)Trading Strategy: Bitcoin is likely to end at 25270 as the price breaks the lower parallel channel support this idea This leads us to expect a reversal in the second wave. Usually reversed 50 or 61.8 of the first wave. So wait for the second wave to finish to join the trend again.
Bitcoin/U.S. Dollar (BTCUSD)Technical Indicators: The price is below the MA200 indicating a downtrend. The wave oscillators below Zero-Line momentum are bearish.
More By This Author:
European Stock Market Elliott Wave Investing AndTrading Strategies
Elliott Wave Technical Analysis: Spotify Inc.
Elliott Wave Technical Analysis: Chainlink / U.S. Dollar


Comments
Log in or sign up to join the conversation.