
Analog Devices Inc., Elliott Wave Technical Analysis

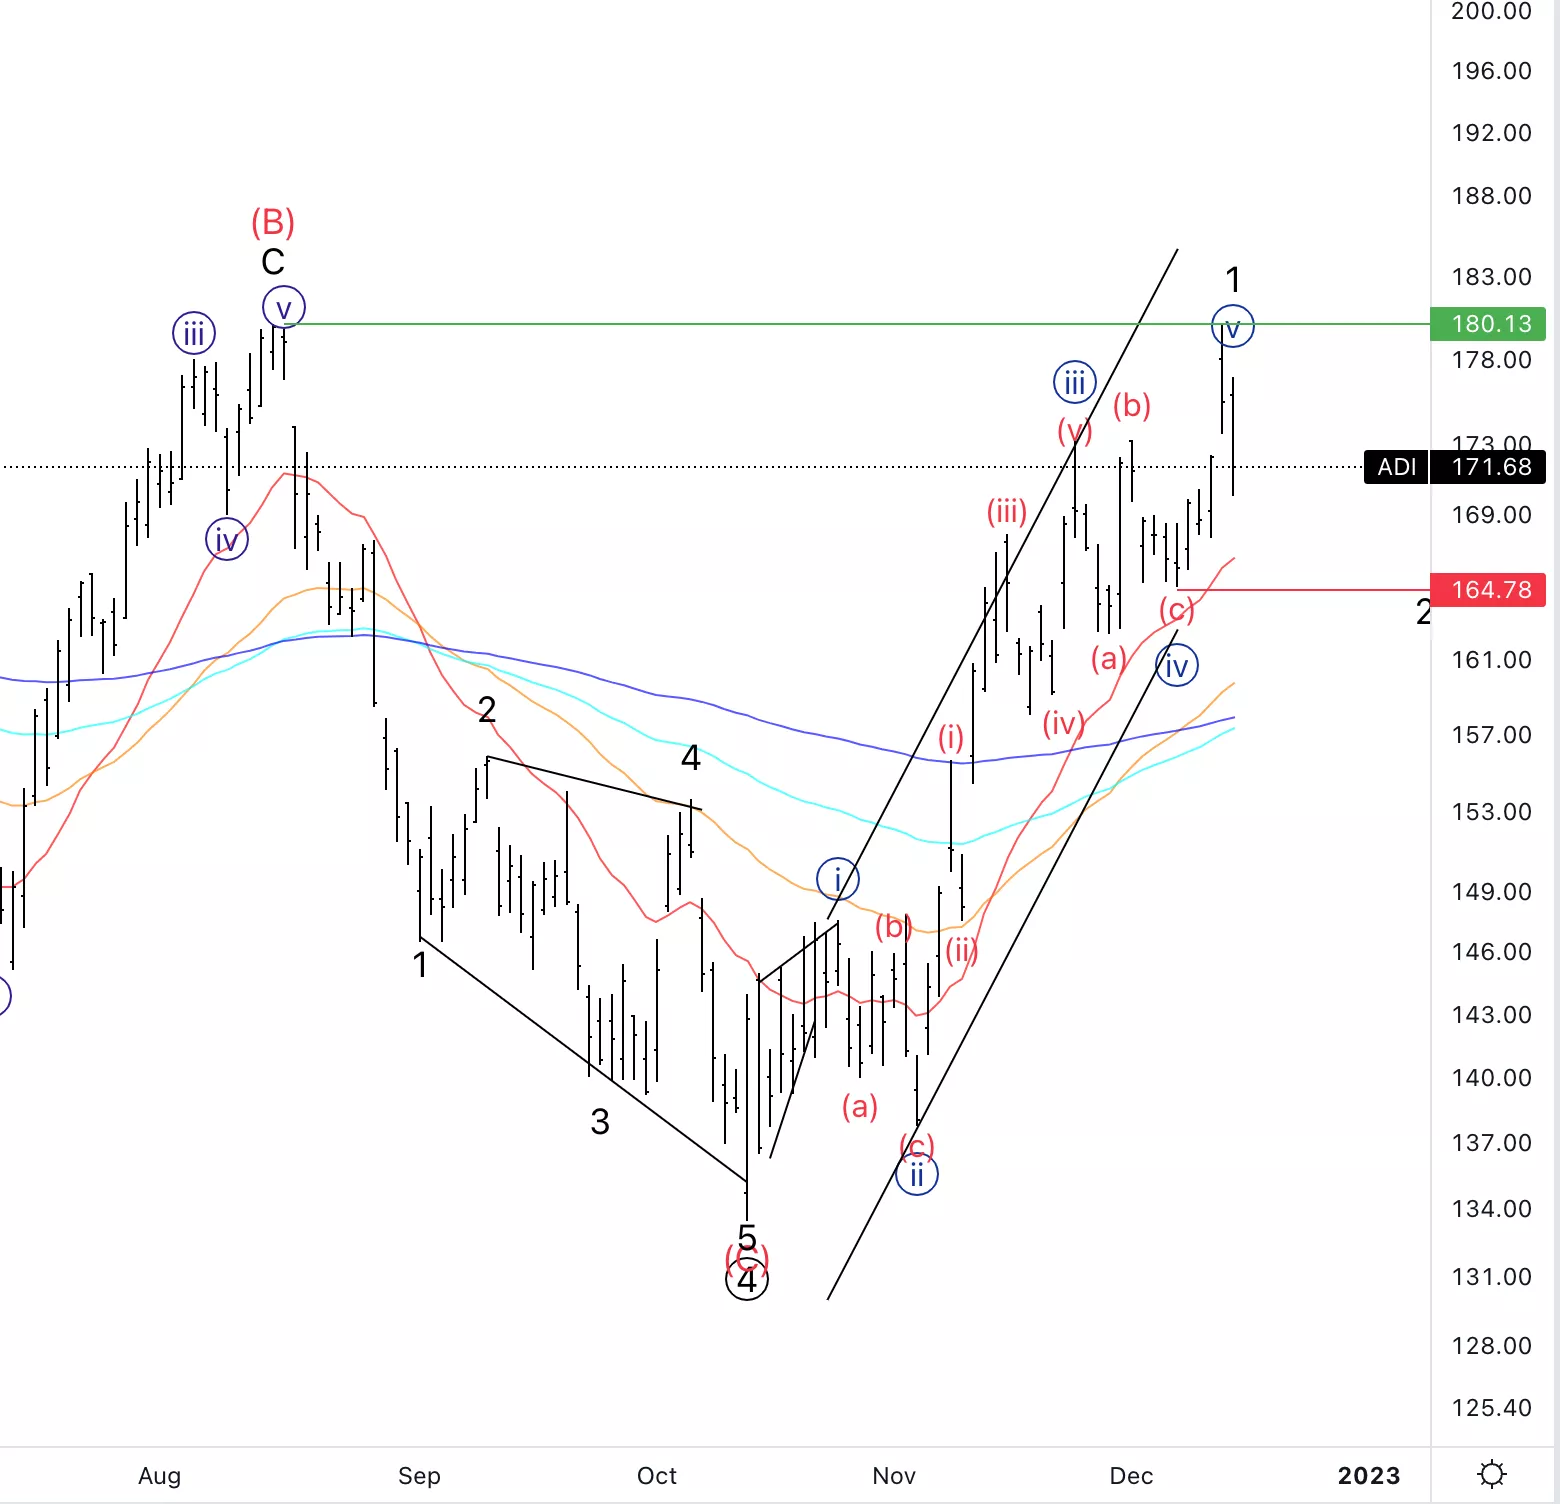
Analog Devices Inc., (ADI): Daily Chart, December 15 2022,
ADI Stock Market Analysis: It has been moving as expected from the previous update. Looking for a potential top in place as we could have started wave 2.
ADI Elliott Wave Count: Wave {v} of 1.
ADI Technical Indicators: Above all averages.
ADI Trading Strategy: Looking for longs on the pullback in wave 2.
TradingLounge Analyst: Alessio Barretta
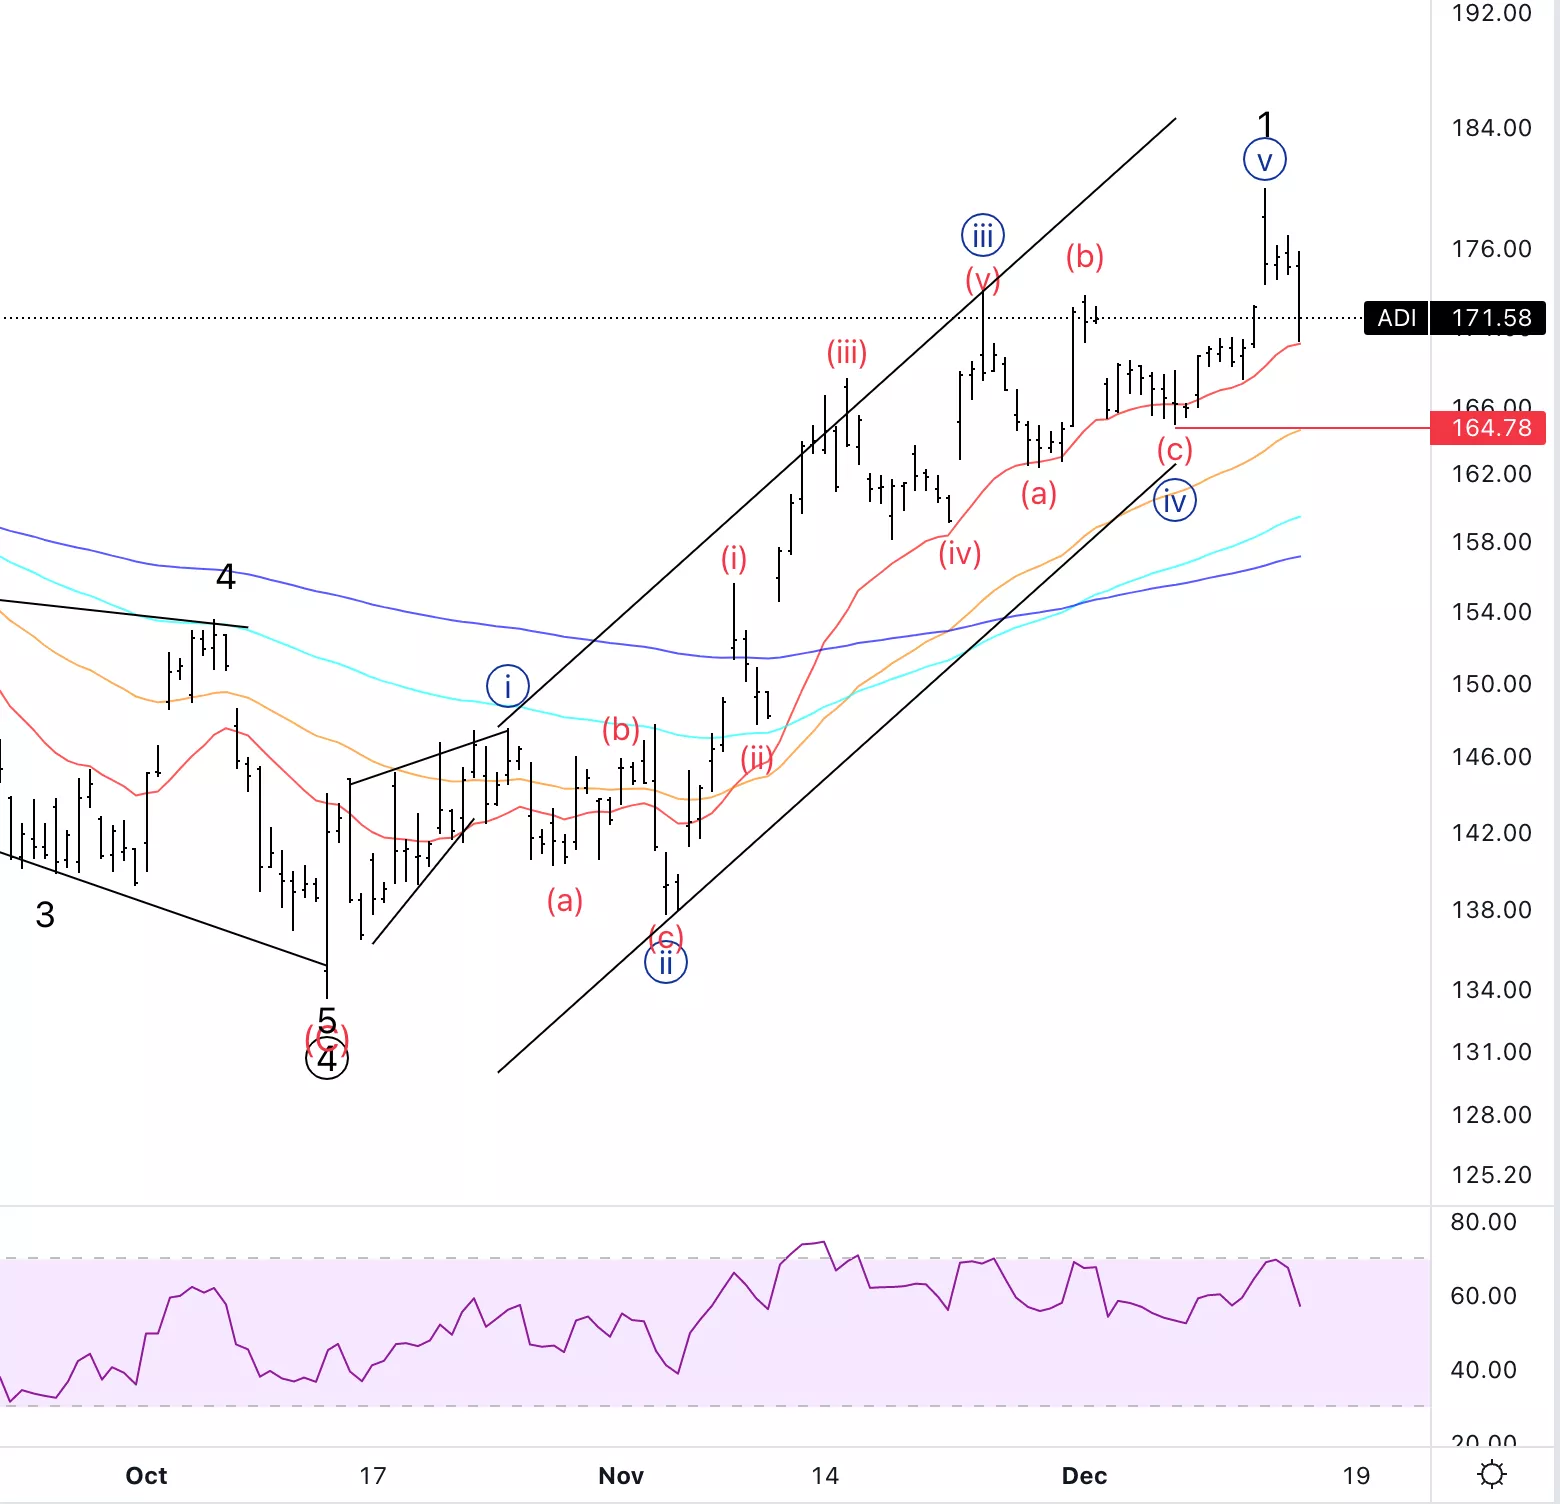
Analog Devices Inc., ADI: 4-hour Chart, December 15, 2022
Analog Devices Inc., Elliott Wave Technical Analysis
ADI Stock Market Analysis: There is a possibility wave {v} is finished. Alternatively we can bein wave (i) of {v} and extend higher.
ADI Elliott Wave count: Wave {v} of 1.
ADI Technical Indicators: Currently using the 20EMA as support and the top in wave {v} has been made on RSI divergence.
ADI Trading Strategy: Looking for longs into wave {v} if we turn out to be in wave (i) of {v} or else we are looking for shorts.
More By This Author:
Elliott Wave Technical Analysis: Bitcoin/US Dollar, Thursday, Dec. 15
Elliott Wave Technical Analysis: Fortinet Inc. - Wednesday, Dec. 14
Elliot Wave Technical Analysis: Tron/USD, Wednesday, Dec. 14


Comments
Log in or sign up to join the conversation.