
Analog Devices Inc., Elliott Wave Technical Analysis

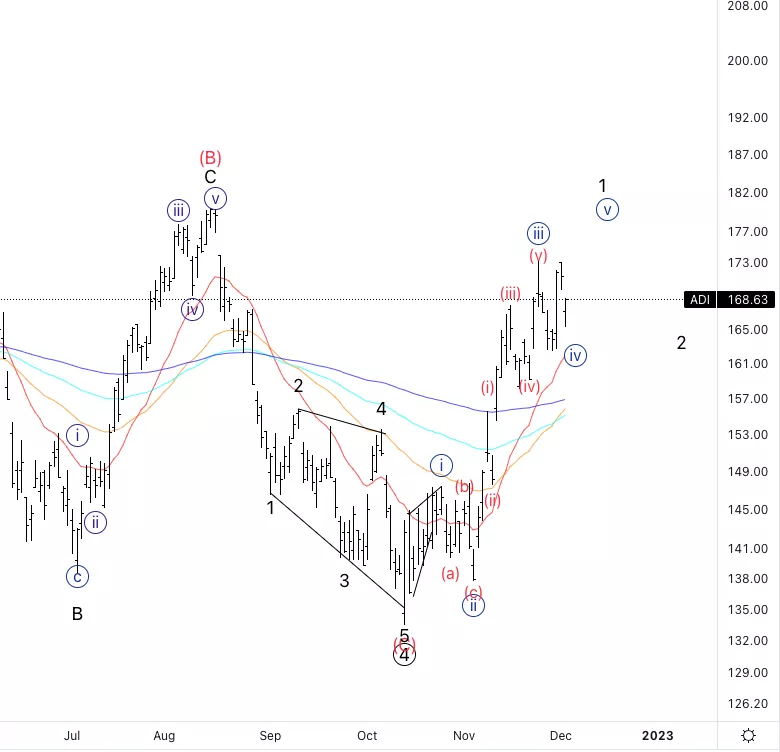
Analog Devices Inc., (ADI): Daily Chart, December 5 2022,
ADI Stock Market Analysis: I slightly changed the count to allow for further upside into one last move higher in wave {v}.
ADI Elliott Wave Count: Wave {iv} of 1.
ADI Technical Indicators: Above all EMAs.
ADI Trading Strategy: Looking for longs into wave {v} being aware that the upside should be limited.
TradingLounge Analyst: Alessio Barretta
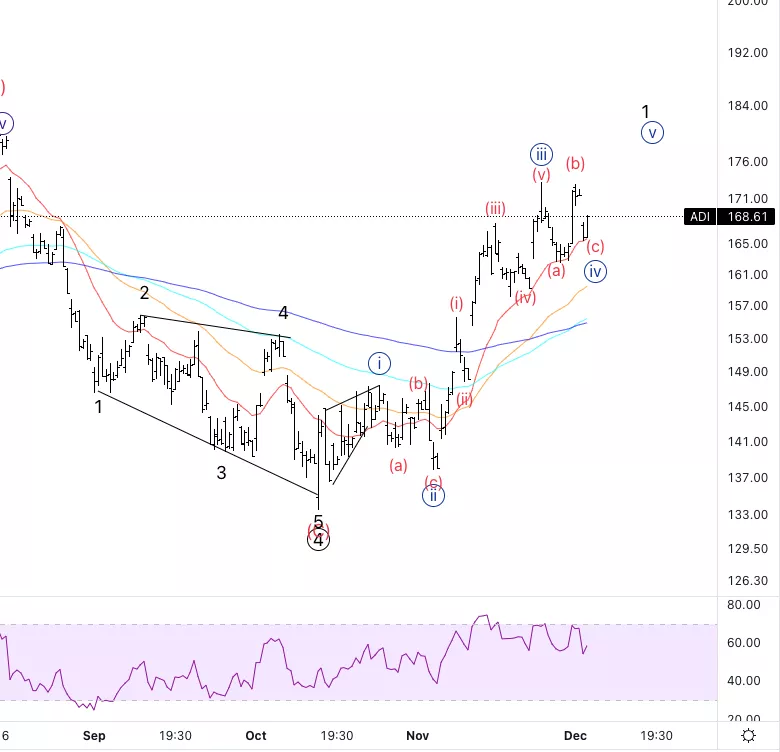
Analog Devices Inc., ADI: 4-hour Chart, December 5 2022
Analog Devices Inc., Elliott Wave Technical Analysis
ADI Stock Market Analysis: Looking for wave {iv} to potentially be a running flat as it stands right now. We are seeing bearish RSI divergence which could signify an imminent wave {v}
ADI Elliott Wave count: Wave (c) of {iv}.
ADI Technical Indicators: 20EMA currently acting as support.
ADI Trading Strategy: Could be looking for longs with a stop below wave (iv) or else wait for further confirmation.
More By This Author:
Elliott Wave Technical Analysis: Bitcoin, Monday, Dec. 5
Market Technical Analysis - S&P 500 Index & 6 Sector ETFs
S&P 500 Stocks Elliott Wave Analysis


Comments
Log in or sign up to join the conversation.