


Image Source: Pixabay
Analog Devices Inc., Elliott Wave Technical Analysis
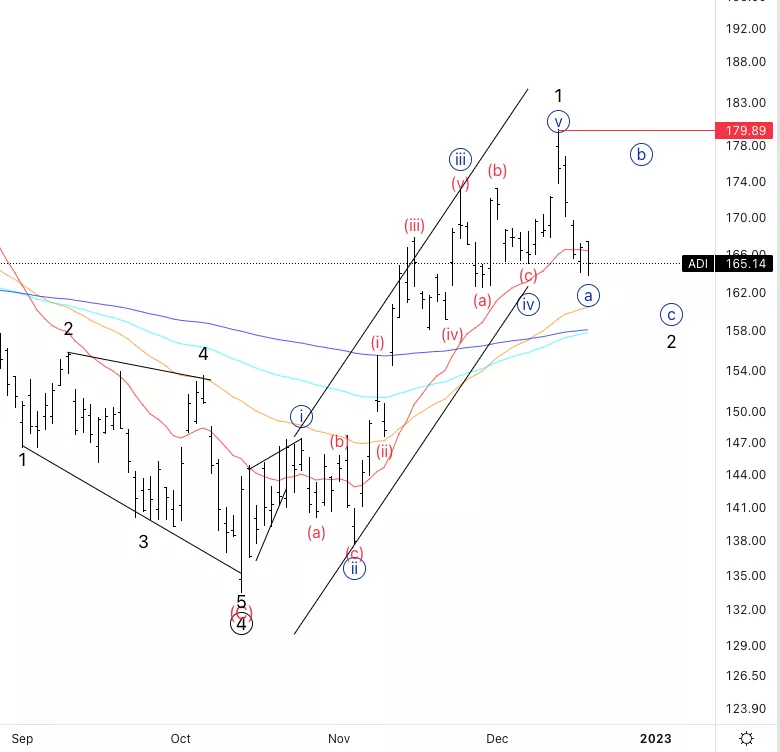
Analog Devices Inc., (Nasdaq: ADI): Daily Chart, December 20 2022,
ADI Stock Market Analysis: At this point we have topped in wave 1 and are now pullbing back inwhat could be wave 2. Looking for a clear three wave move into wave 2 to then look for longs.
ADI Elliott Wave Count: Wave {a} of 2.
ADI Technical Indicators:20EMA acting as resistance
ADI Trading Strategy:Looking for the end of wave 2 to then place longs.
Analyst: Alessio Barretta
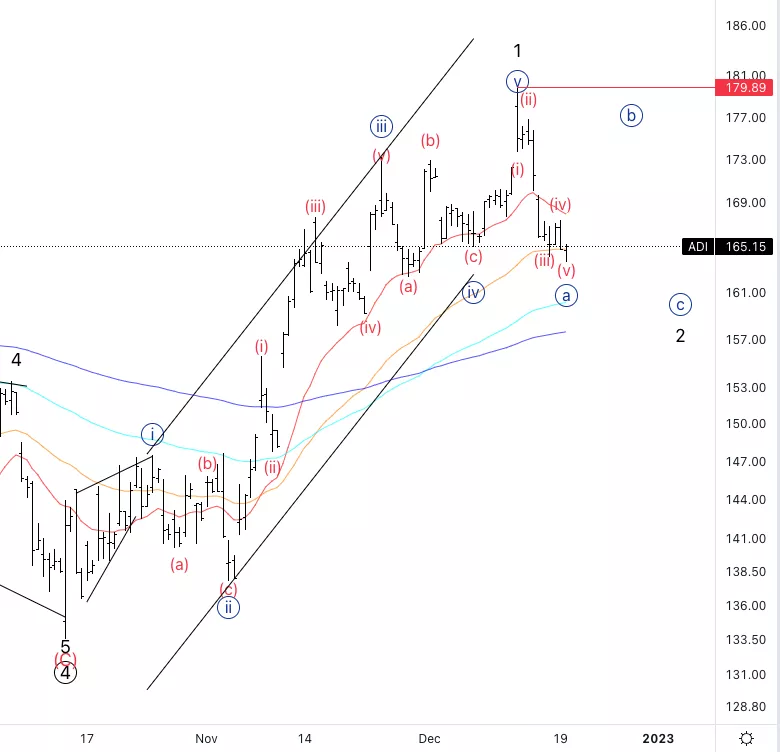
Analog Devices Inc., ADI:4-hour Chart, December 20 2022
Analog Devices Inc., Elliott Wave Technical Analysis
ADI Stock Market Analysis:It seems like we have five waves down into wave {a} and arelooking for upside into wave {b}. We could potentially find resistance on the way back to the20EMA or else to the area of wave (ii) of {a}.
ADI Elliott Wave count: Wave (v) of {a}.
ADI Technical Indicators: In between averages.
ADI Trading Strategy:Looking for shorts into wave {c} with a stop above wave {a}.
More By This Author:
Bitcoin To $15.000...
Elliott Wave Technical Analysis: CSX Corp. - Monday, Dec. 19
Cardano / U.S.dollar(ADAUSD) Elliott Wave Technical Analysis 19 December 2022



Comments
Log in or sign up to join the conversation.