

Photo by Emily Bernal on Unsplash
Adobe Inc., Elliott Wave Technical Analysis
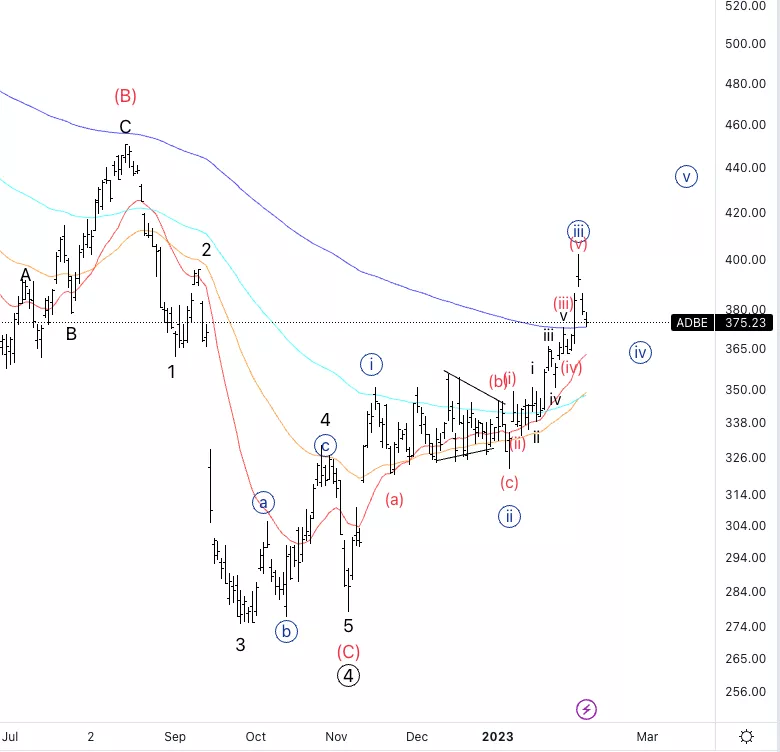
Adobe Inc., (Nasdaq: ADBE): Daily Chart, 7 February 23,
ADBE Stock Market Analysis: Looking for further upside into wave {v}. As we have had a sideways wave {ii} it would make sense to form a sharp correction in wave {iv}. There is a possibility we are just in an abc correction and we will resume lower.
ADBE Elliott Wave Count: Wave {iv} of 1.
ADBE Technical Indicators: Above all averages, 200EMA as support.
ADBE Trading Strategy: Looking for an end of wave {iv} to then look for longs.
Analyst: Alessio Barretta
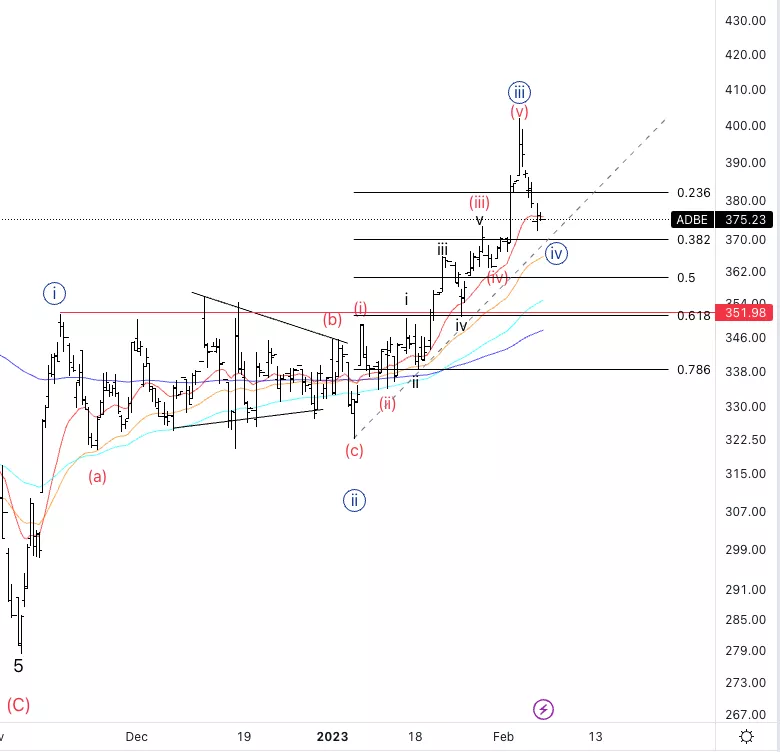
Adobe Inc., ADBE: 4-hour Chart, 7 February 23,
Adobe Inc., Elliott Wave Technical Analysis
ADBE Stock Market Analysis: We do not have signs that the downside in wave {iv} is completed yet, even If we are close to the 38.2% as well as we are entering a zone of support.
ADBE Elliott Wave count: Wave {iv} of 1.
ADBE Technical Indicators: 20EMA as support.
ADBE Trading Strategy: Looking for evidence wave {iv} is over to enter long.
More By This Author:
Strong Dollar - Softer DAX 40 - FTSE 100 - DXY - GBPUSD - EURUSD: Elliott Wave
ASX Stock Market Report
Elliott Wave Technical Analysis: United Parcel Service Inc. - Monday, Feb. 6


Comments
Log in or sign up to join the conversation.