


Image Source: Pixabay
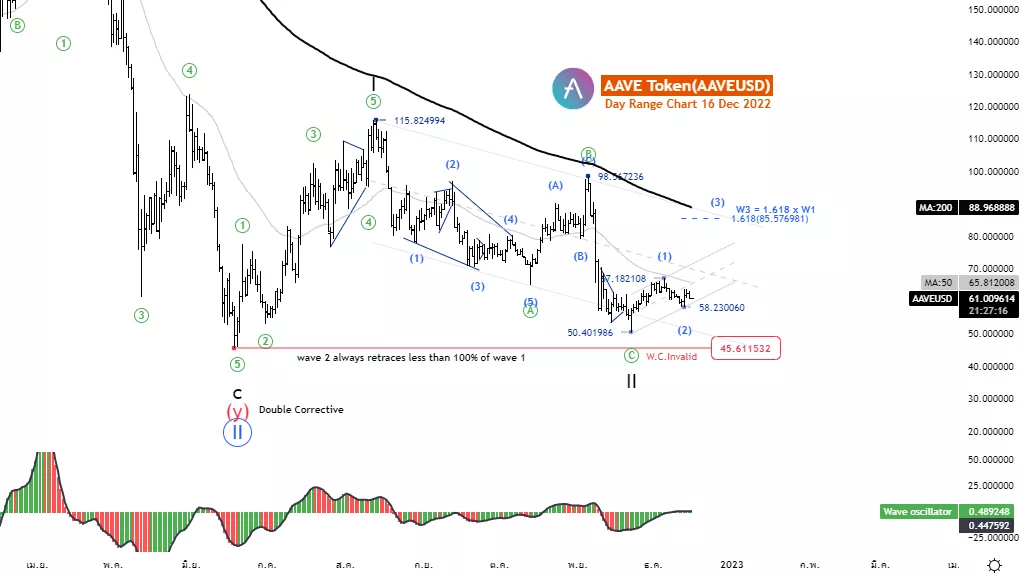
Elliott Wave Analysis TradingLounge Daily Chart, 16 December 2022,
AAVE/U.S.Dollar (AAVEUSD)
AAVEUSD Elliott Wave Technical Analysis
Function: Follow trend
Mode: Motive
Structure: Impulse
Position: Wave 3
Direction Next higher Degrees: Wave III of Motive
Details: The rise of wave 3 usually has a length of 1.618 x wave1
Wave Cancel invalid Level:45.611
AAVE/U.S.Dollar (AAVEUSD) Trading Strategy: AAVE token price remains under selling pressure below MA200 MA50, indicating a strong downtrend. The wave oscillator is slow down with decreasing momentum, but if the price level is maintained. There is a tendency to reverse upward again. And we expect the price to trade above 115.82 overall, but we still need to trade cautiously as there is still some selling pressure.
AAVE/U.S.Dollar (AAVEUSD) Technical Indicators: The price is below the MA200 MA50, indicating a clear downtrend. The wave oscillator is slow down with decreasing momentum.
Analyst: Kittiampon Somboonsod
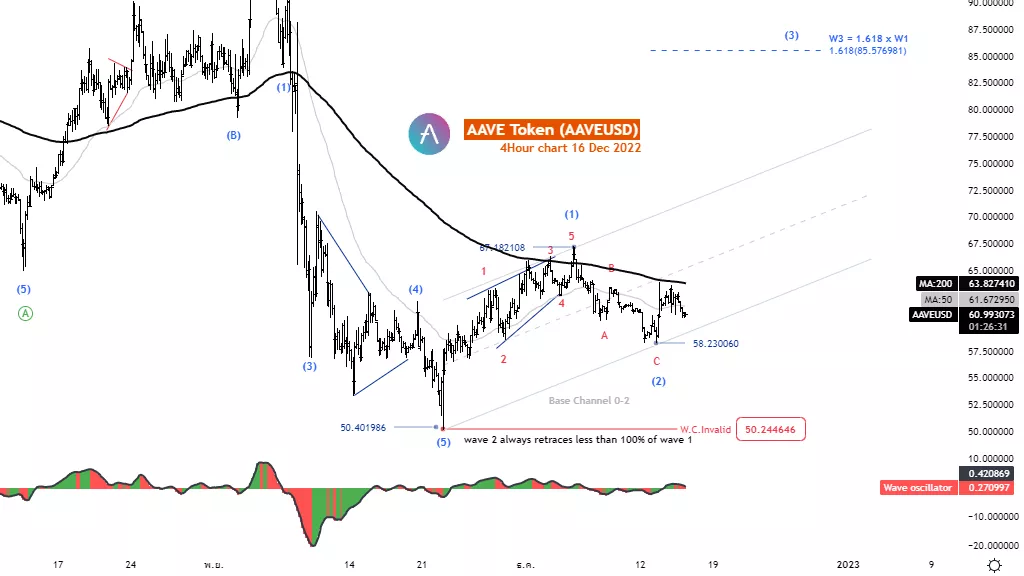
Elliott Wave Analysis TradingLounge 4H Chart, 16 December 2022,
AAVE/U.S.Dollar (AAVEUSD)
AAVEUSD Elliott Wave Technical Analysis
Function: Follow trend
Mode: Motive
Structure: Impulse
Position: Wave 3
Direction Next higher Degrees: Wave III of Motive
Details: The rise of wave 3 usually has a length of 1.618 x wave1
Wave Cancel invalid Level:50.244
AAVE/U.S.Dollar (AAVEUSD) Trading Strategy: AAVE token price remains under selling pressure below MA200 MA50, indicating a strong downtrend. The wave oscillator is slow down with decreasing momentum, but if the price level is maintained. There is a tendency to reverse upward again. And we expect the price to trade above 85.57 overall, but we still need to trade cautiously as there is still some selling pressure.
AAVE/U.S.Dollar (AAVEUSD) Technical Indicators: The price is below the MA200 MA50, indicating a clear downtrend. The wave oscillator is slowed down with decreasing momentum.
More By This Author:
U.S. Stocks Elliott Wave - Further Lows To Follow
Elliott Wave Technical Analysis: Analog Devices, Thursday, Dec. 15
Elliott Wave Technical Analysis: Bitcoin/US Dollar, Thursday, Dec. 15



Comments
Log in or sign up to join the conversation.