


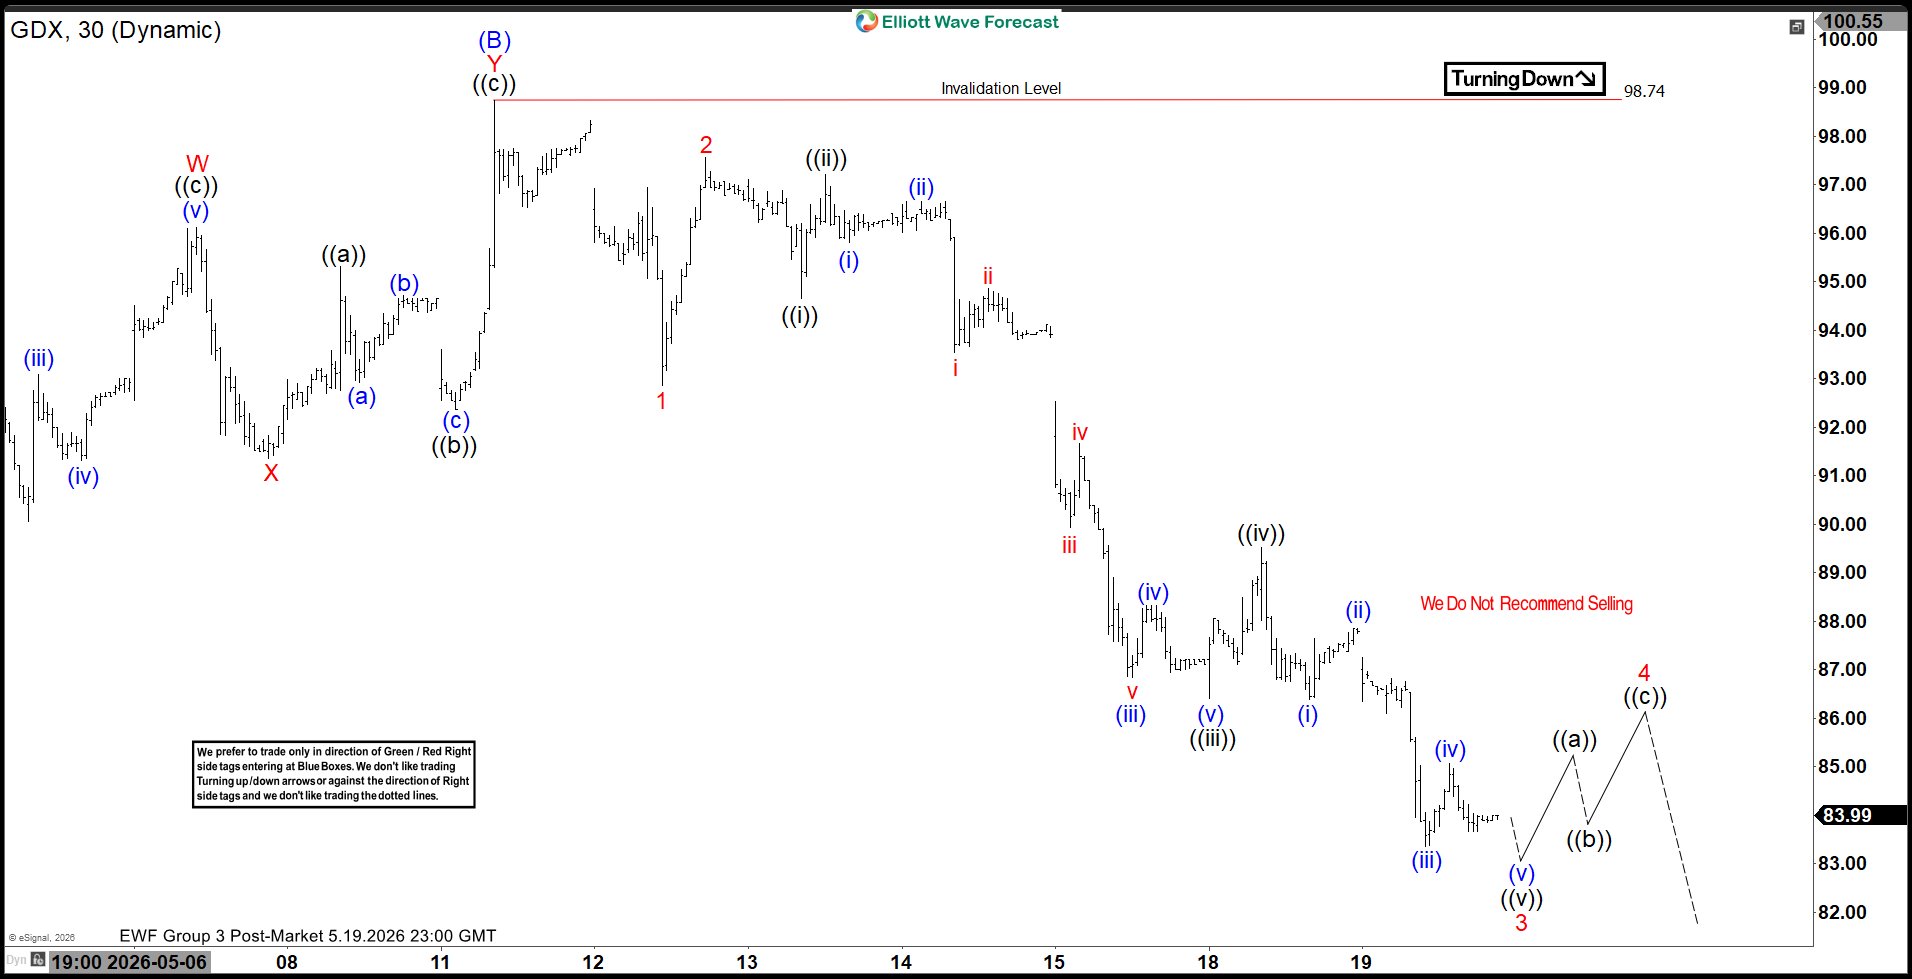
The short‑term Elliott Wave outlook for Gold Miners ETF (GDX) shows a correction unfolding from the March 20, 2026 low. This move is developing as a zigzag structure, a common three‑wave corrective pattern. From the March 20 high, wave (A) ended at $85.46, followed by a rally in wave (B) that reached $98.74. The ETF has since turned lower, with wave (C) now in progress and subdividing into five smaller waves.
From the peak of wave (B), wave 1 concluded at $92.85. A corrective rally in wave 2 then advanced to $97.56. The ETF extended lower in wave 3, which is expected to finish soon. Afterward, a rally in wave 4 should emerge, likely in three or seven swings, before a final decline in wave 5 completes wave (C). The downside target aligns with the 100% Fibonacci extension of wave (A) and the prior pivot low of March 20, 2026. This area falls between $78.74 and $81.90, forming a critical support zone.
Near term, as long as price remains below $98.74, GDX retains scope to extend modestly lower before stabilizing. A decisive break beneath $78.74, however, would imply that the correction is evolving into a larger double structure. This scenario highlights the importance of monitoring Fibonacci projections and prior pivots to anticipate the next directional move.
Gold Miners ETF (GDX) 60-Minute Elliott Wave Chart
Comments
Log in or sign up to join the conversation.