
Elbit Systems Ltd., Elliott Wave Technical Analysis
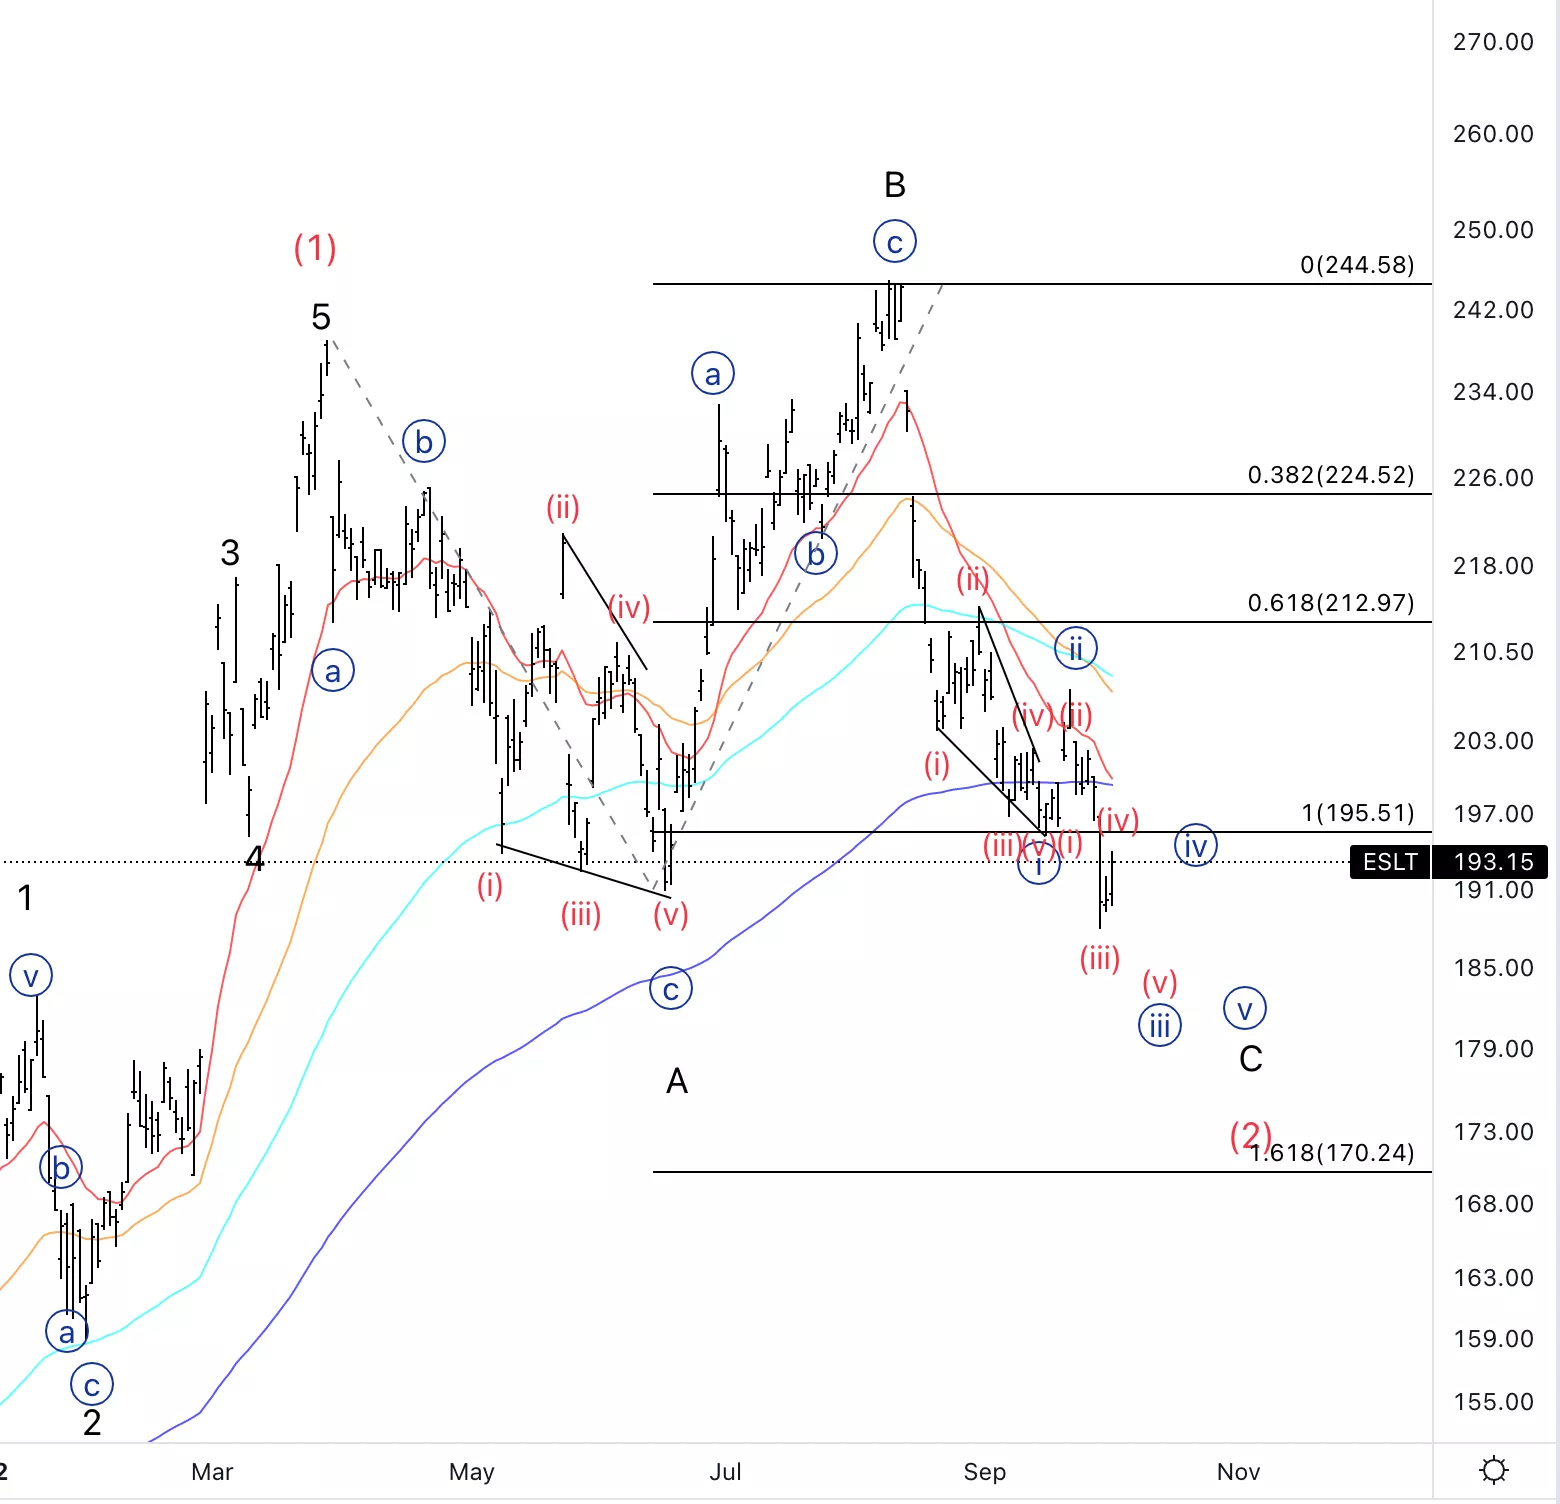
Elbit Systems Ltd., (ESLT): Daily Chart, October 4 2022,
ESLT Stock Market Analysis: Looking for further downside as we can see what appears to be a leading diagonal in wave {i}
ESLT Elliott Wave count: {iii} of C.
ESLT Technical Indicators: All indicators are signaling bearish momentum with the 20 and 200EMAs trying to cross.
ESLT Trading Strategy: Looking to short on wave (iv) and {iv}.
(Click on image to enlarge)
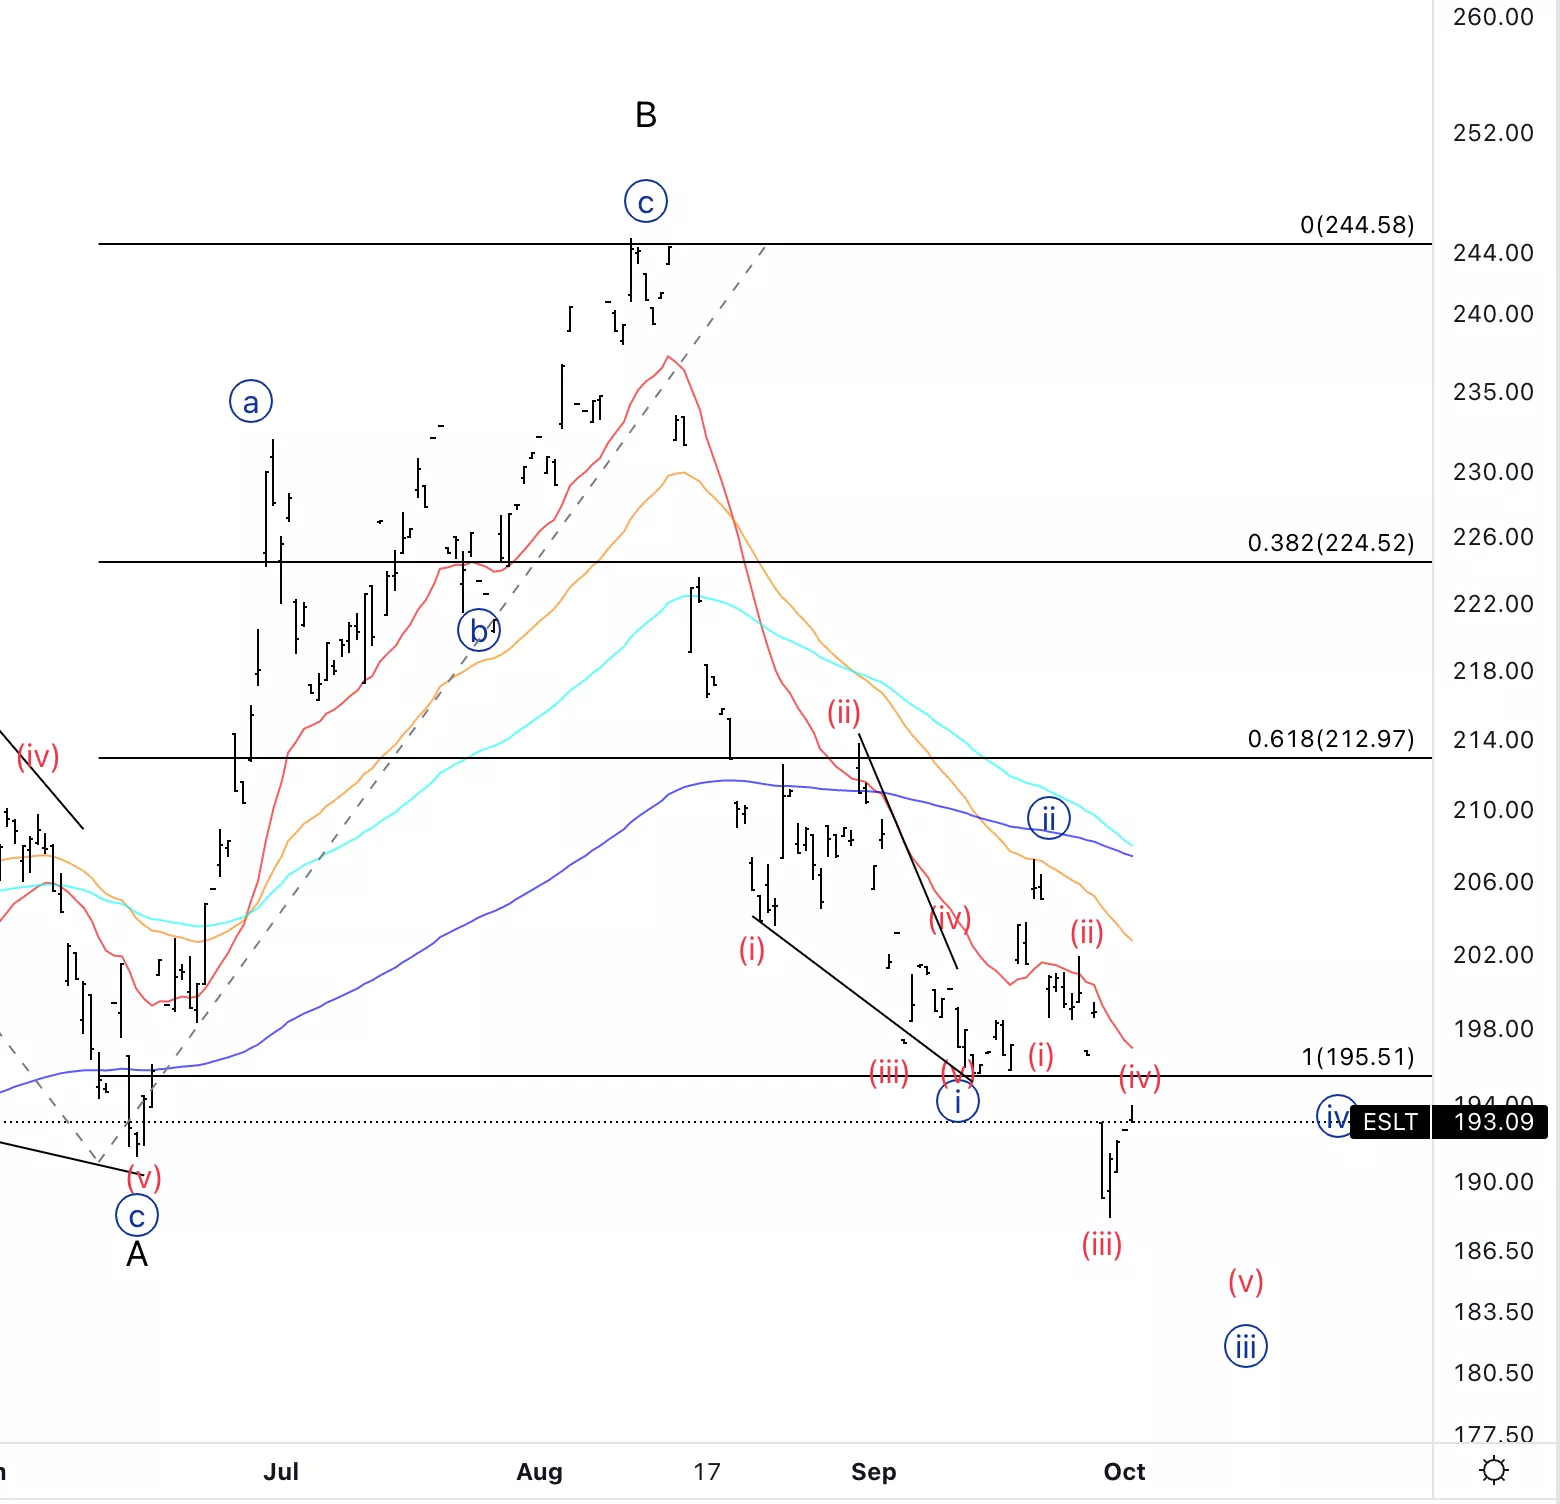
Elbit Systems Ltd., ESLT: 4-hour Chart, October 4 2022
Elbit Systems Ltd., Elliott Wave Technical Analysis
ESLT Stock Market Analysis: Looking for further downside as the whole move down appears tobe incomplete.
ESLT Elliott Wave count: (iv) of {iii}.
ESLT Technical Indicators: All indicator are bearish with the 20 EMA(red line) potentially acting as resistance.
ESLT Trading Strategy: Looking to short even in this wave (iv) with a stop below the low of wave (ii).
(Click on image to enlarge)
More By This Author:
ASX200, CBA, BHP, FMG, RIO, Lithium Stocks, GDX, GOLD, NCM, DXY, AUDUSD Elliott Wave
Dogecoin (DOGEUSD) Elliott Wave Technical Analysis 4 October 2022
SP500 Elliott Wave Analysis (c) Of Iv) Of 3 Of (1)


Comments
Log in or sign up to join the conversation.