
The trading week that was proved confounding for many with twists and turns throughout the trading week. When it was all said and done, however, the S&P 500 (SPX) finished lower by roughly 1/2 percent from the previous week. The good news is that while the week started with a significant 3% drop on Monday, it was followed by an even bigger 3-day rally.
All Things S&P 500
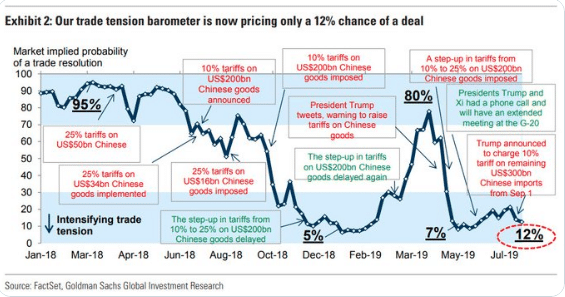
The "buy the dip" mentality on Wall Street remains firmly in place, despite looming trade feuds that appear to be escalating and with a potential to become more realized on September 1st, as the U.S. readies for an additional 10% tariff on $300bn worth of Chinese goods. Given the heightened state of trade rhetoric that seems to be diminishing the likelihood of a trade deal, it remains to be seen how investors position leading up to the September 1st deadline. At present, the pathway to execute a deal between the U.S. and China is quite narrow and found to be with limited potential and all but absent investor belief, according to a survey by Goldman Sachs.
Coming into the trading week, Finom Group (for who I am employed) offered our near-term outlook for the S&P 500, which is a simple reiteration of anticipated drawdowns in the benchmark index. We had been anticipating a pullback for the last month and with elevated cash positions so as to lock in profits that had been achieved year-to-date.
"Finom Group’s conviction of a short-term correction to rebalance portfolios remains high.We believe that correction will occur over the next 2 months to reverse the overbought conditions from the last 45 days. A 3 to 7% correction in August – September is likely and increasingly probable given all that has been stated within our Research Report.”
From the recent all-time high in the S&P 500 to the trough of the past trading week, the S&P 500 has pulled lower by more than 6 percent. While a sharp rebound in the market ensued during the middle of the week, the fundamentals surrounding market fear and angst have not changed or found remedy to guide us forward from a fundamental perspective.
- Global growth has continued to weaken
- Additional tariffs are still in play
- Fund flows continue to favor bonds over equities
- Manufacturing deterioration may be moving toward non-manufacturing downturn.
- Currency skirmishes are now headlining
In spite of a 2nd consecutive week of losses in the major averages, the S&P 500 14-day RSI actually improved to just above 45. This is known as a positive divergence.
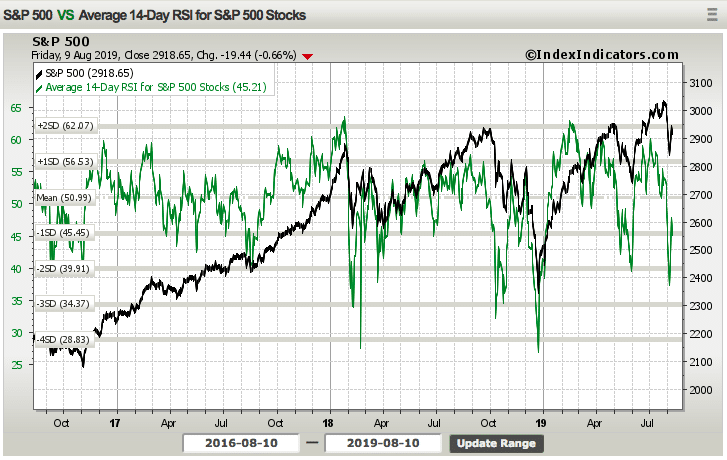
The current 14-day RSI is expressing neither overbought or oversold conditions, but rather neutral and possibly indecisiveness amongst investors. One thing is for sure, there have been two key factors moving markets over the last 5 trading days, bond yields and China's support for the Yuan. Probably the biggest two headlines of the week concerned China allowing the Yuan to crack below 7:1 CHN/DXY level and the 10-year yield briefly dropping below 1.6% on Wednesday. With global yields dropping precipitously in response to Thailand, New Zealand and India all lowering interest rates, equities tumbled.
(Click on image to enlarge)
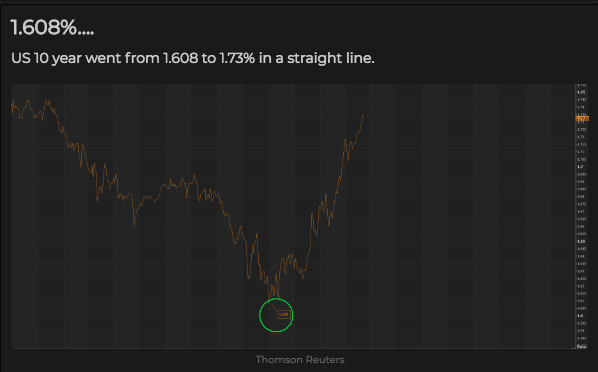
As part of a broader point, however, investors should continue to consider that the volatility in the bond market has and can continue to spill over into the equity market. With the 10-year yield finding a bottom on Wednesday, it rebounded alongside an equity market rebound.
In analyzing the focus investors paid toward the bond market over the past several weeks, we see some extreme overbought conditions in the 10-year Treasury. Only 2 other times, as depicted in the chart below, has the 10-year yield been this extended since 1995.
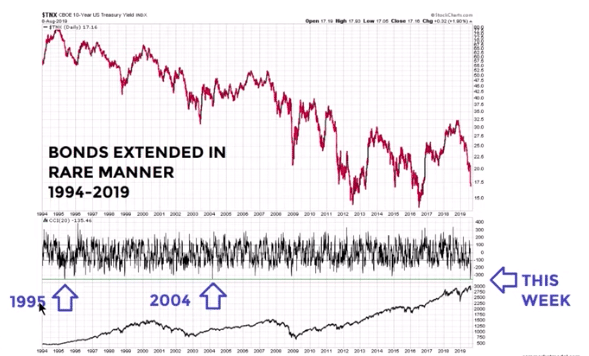
It's clear that the bond rally is and has been overextended. It's rather unique that as the bond rally wagers on, however, the front end of the yield curve has not corrected to the degree the long end of the yield curve has, which is of concern. This gives Finom Group reason to remain cautious, as the bond market is clearly signaling something more sinister may be in-store for the economy and/or equity market. With that being said, we also desire to take a look at more technicals and specifically as it pertains to of the SPY:TLT ratio. (equity:bond ratio)
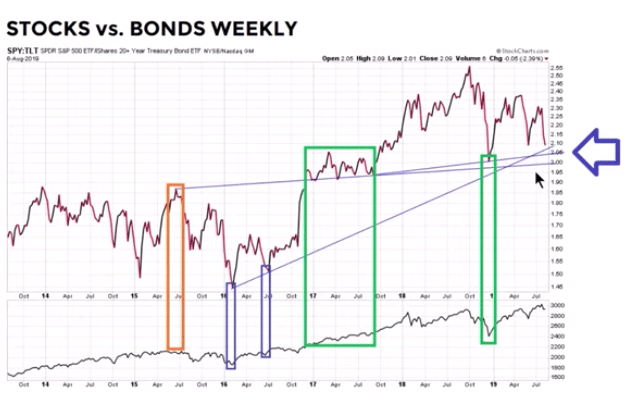
From the chart above, we can see that the SPY:TLT ratio is nearing a trend-support line (Arrow). The narrow, green rectangular box identifies the trough in the SPY:TLT ratio being hit in December 2018 (SPX bottom box). Once that support line was hit, the market rebounded. Given that there is still some "air" between the ratio and the trend-support line, this suggests that in the next couple of weeks the market will make it's ultimate decision on its trajectory for the interim period. There is still some time to rebalance one's portfolio.
Moreover, each trading day of the past week found equity futures sharply lower in the evening and leading into the Chinese equity markets opening. Selling futures was largely due to the "crack 7" that occurred on Monday and which finds investors considering whether or not China will allow for "crack 7" again or if it was just a retaliatory measure from the threatened tariffs on September 1st. Of course the only day the evening equity futures were not lower was on Friday, given that the Chinese markets would be closed Saturday and Sunday.
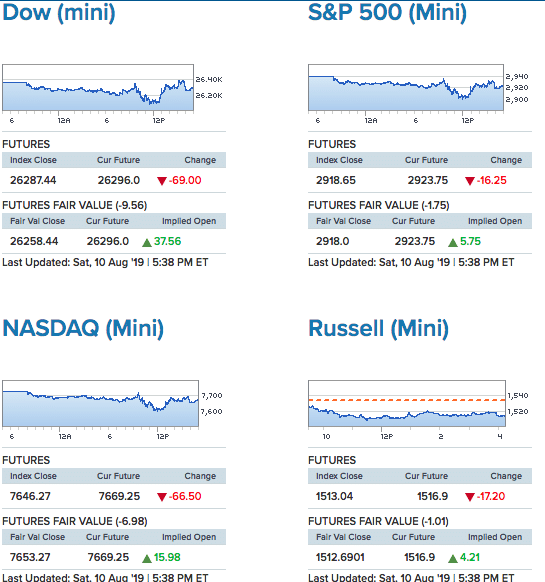
All equity futures fair value were reasonably positive on Friday evening, validating the aforementioned analysis. On Sunday evening when futures reopen at 6:00 p.m. EST, however, it is quite possible that futures will revert until China's markets open and the Yuan peg is known. The focus on the Chinese support for the Yuan is also likely to be the reason for such a sharp decline in the final minutes of trading in the U.S., on Friday. With roughly 15 minutes to go in the trading day and a long weekend without the desire to risk another "crack 7" Monday market open, investors took some chips off the table.
To reiterate, equity markets are highly focused on the currency feud that is newly presented and the bond market signals. Correlations remain very tight heading into a very laborious economic data week.
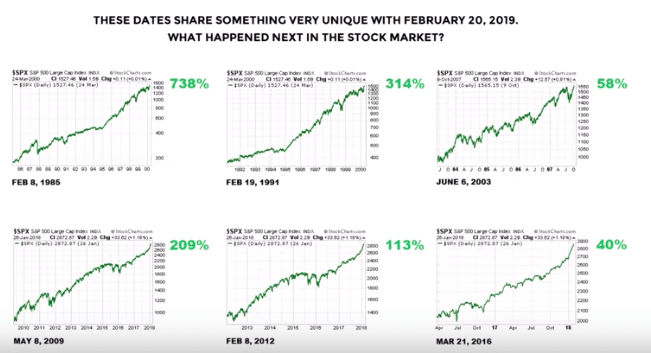
The greater technical overview of the market at present and within a distribution/pullback phase suggests further drawdowns are more probable than not. Finom Group, as always, would be happy to be proven wrong while continuing to trade what the market delivers on a weekly basis. With a subdued tone behind us there are some more long-term considerations that remain highly relevant and bullish. Investors should not lose sight of the fact that the NYSE Breadth Momentum Oscillator had a bullish crossover in February 2019, something that has only occurred 7 other times since 1985.
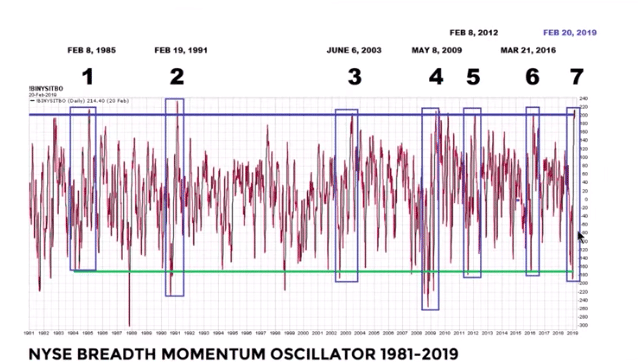
In addition to this recognized breadth thrust indicator and occurrence, historical evidence suggests the market produces strong returns thereafter, as outlined by Ciovacco Capital.
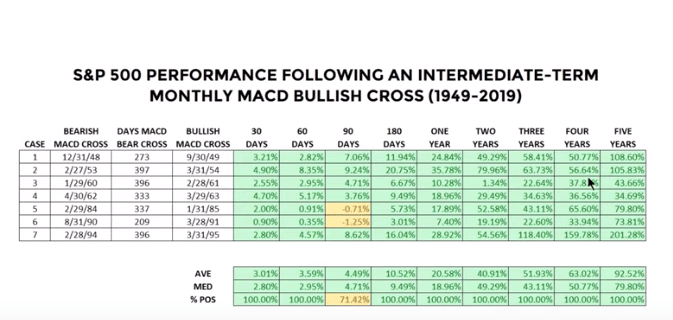
A monthly MACD crossover is historically another bullish signal for the market, with significant gains having occurred in all past cycles out 1, 2, 3, 4, and 5 years.
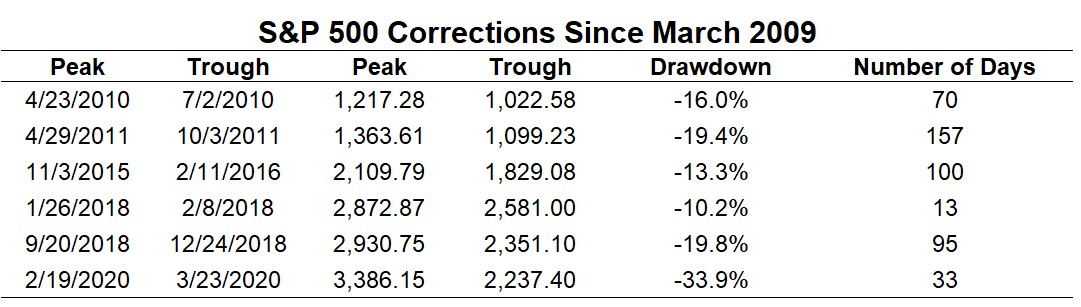
The market is a jittery place to participate and may continue to be so over the next couple of weeks. The question on many investors' minds, given the still present fears from December 2018, is whether or not we'll revisit those December lows. From July 26 through August 5th close, the S&P 500 lost 6 percent. Even though stocks have rebounded the past few days, the index remains several percentage points off the highs. While heightened volatility may be here until the tariff threats move beyond threats, technical analysis suggests the market is unlikely to revisit the December lows. We stress, that's just the technical analysis, which is primed by the underlying fundamentals.
In LPL Financials latest "chart of the day", here is what the firm has to offer:
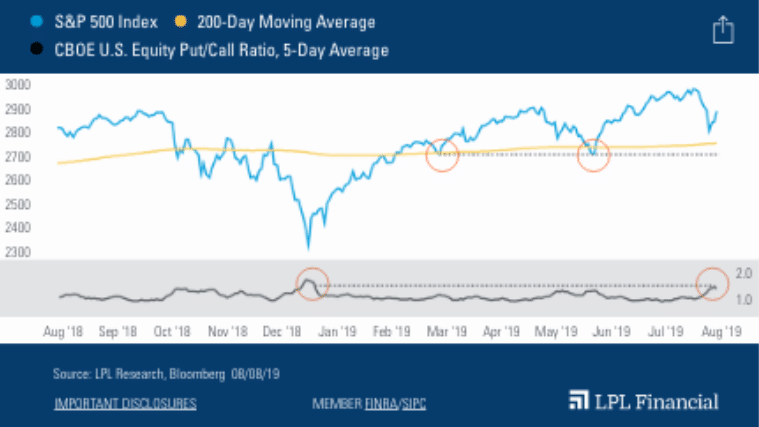
"The June lows near 2,740 have been a key pivot point for the index going back to February 2019. In addition, the 5-day put/call ratio surged to its highest level since December, suggesting investor demand for protection was high, a bullish indicator for stocks in our view."
The S&P 500 is currently just below the 50-DMA, but above both the 200 and 100-DMAs. Institutional investors do not seem to be overly bullish or bearish on the market, depending on how you view the technicals and investor positioning. Speaking of sentiment and positioning, the latest reports from J.P. Morgan Chase identify some deleveraging in August, but net and gross leverage are not akin to that which preceded the December 2018 bear market. Given the volatility in the market during the past week, there have been comparisons made with the Q4 2018 selloff.
The end of week leverage snapshot shows that unlike Q4, gross leverage did not drop dramatically and is still close to 2019 highs.
Gross Leverage: 2.53 to 2.75 (up 8.7%), at 89th percentile since January 2018.
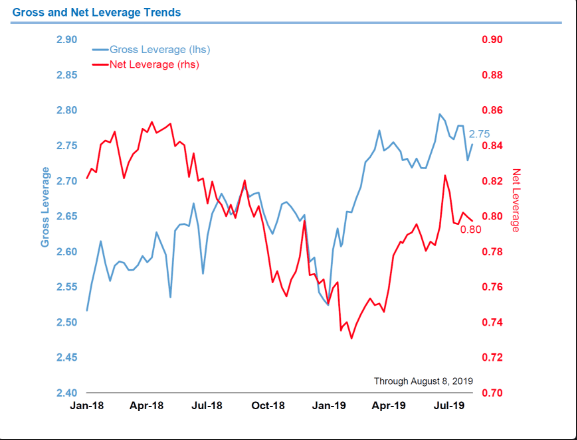
Net Leverage: 0.73 to 0.80 (up 4.3%), at 51st percentile since January 2018.
Pre-Q4 Levels:
- Gross Leverage: Pre-Q4 levels (2.70) exceeded in February 2019, currently at 2.75.
- Net Leverage: Pre-Q4 levels (0.82) reached in June 2019, currently at 0.80
This simply serves to identify that even positioning is not akin to the the Q4 period. Investors are positioned more optimistically, although not at YTD highs. This of course will adjust week-to-week and should not be used as a guide for individual portfolio positioning.
China/U.S. Trade Feud Escalation
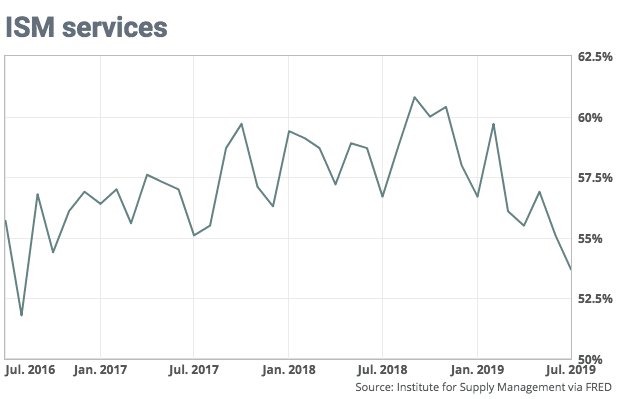
The ongoing trade feud poses serious consequences for the global economy near-term and domestic economy medium-term. Because the U.S. economy is a more consumer driven, services based economy, it is also an import economy, somewhat insulated from manufacturing woes that underpin nations like China and Germany. Of late, we've born witness to some elongated effects from the trade feud that have finally found a trend of weakening service sector results, as measured through the ISM manufacturing index.
The trend in service sector data does suggest that even an import powerhouse such as the United States, eventually bears the brunt of the pain brought about by imposed tariffs in a globally interconnected economy. As such, we aim to decipher the probabilities from the threatened tariffs set to go into affect on September 1st. The calculous for imposing these tariffs, a 3rd traunch that would land squarely on the shoulders of consumers, seems hazardous for the President of the United States who is heading into an election year. Nonetheless, we reflect on already imposed tariffs that are already weakening business confidence, capital expenditures and manufacturing.
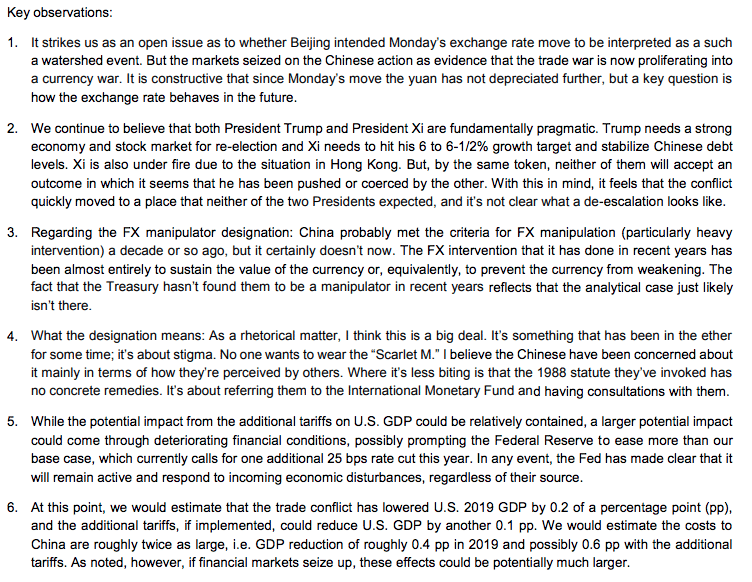
Here is how Nathan Sheets, PhD., Chief Economist and Head of Global Macroeconomic Research at Prudential contemplates the China/U.S. trade feud:
In the ongoing feud, the latest developments have found China confirming the cancellation of all purchases of U.S. agricultural products.
Agriculture exports to China dropped by more than half last year. In 2017, China imported $19.5 billion in agricultural goods, making it the second-largest buyer overall for American farmers. In 2018, that dropped to $9.2 billion as the trade war escalated, according to the United States Department of Agriculture.
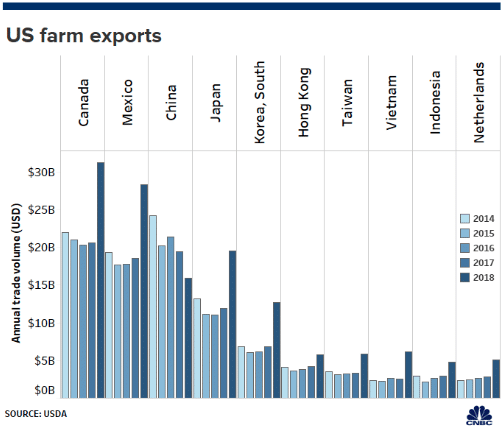
This year, China’s agricultural imports from the U.S are down roughly 20%, and U.S. grain, dairy and livestock farmers have seen their revenue evaporate as a result. Over the last 6 years, farm income has dropped 45% from $123.4 billion in 2013 to $63 billion last year, according to the USDA.
The White House Administration is not just battling China in this trade feud, it is setting itself up for a battle with its own base, which may prove to flip should the trade feud carry forward and find farmers suffer more profit losses, despite bailout programs.

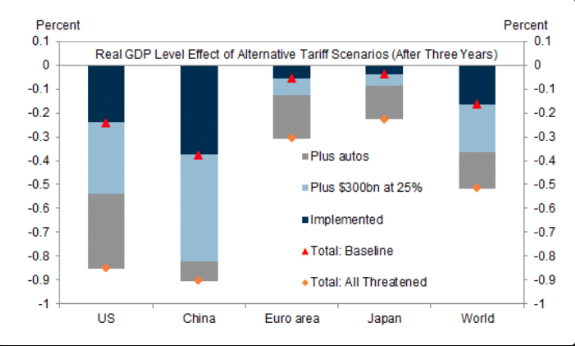
As mentioned previously, the 3rd batch of tariffs, if levied, will directly impact consumer facing products/goods. Everything from an iPhone to Nike sneakers will face tariffs and this will likely pose an impediment for consumers and corporations. Assuming the same trajectory of decreased demand for goods already affected by tariffs, the global economy would almost certainly slow further. Goldman Sachs suggests that if the 3rd batch of tariffs is positioned, the impact would be as follows:
The odds of the 9/1 tariffs going into effect are prob. less than 50%
- Trump outlined two relatively specific (and minor) items in his initial 8/1 tweets which China wouldn’t struggle to deliver on (fentanyl and agricultural purchases)
- political pressure is rising w/various farm/agricultural groups in the US directing relatively pointed rhetoric towards Trump since the 8/1 threat (more pointed than they’ve used in the last few years)
- the 9/1 tariffs will directly impact US consumers for the first time right ahead of the holiday season
- the 2020 campaign season is kicking into full gear and Trump can’t afford to have economic growth and/or a sinking stock market heading into next year.
In the interim, it appears as though the apex of the trade feud is afoot and it will be realized on September 1st for better or for worse. Here is what J.P. Morgan's quant team had to say about the pending September 1st tariff imposition probabilities:
"We do think that after a short period of stabilization, markets will likely regain previous highs, and hence we see this sell-off as a medium-term buying opportunity. The risk to this view is further uncontrolled escalation of trade tensions, which we see as a less likely scenario, given that we’re approaching an election year and a trade-war-induced recession would greatly reduce the probability of the president’s re-election.
Absent Phase III implementation, we do not see the current slowdown resulting in an outright recession. Global manufacturing and old economy sectors have already been hit hard by trade escalation, and related equities are largely pricing this in. We see this weakness partially related to the inventory build-up on account of tariff uncertainty. S&P 500 inventories increased by ~7% y/y and ~5% in 4Q18 and 1H19, respectively, with most of that driven by trade-sensitive sectors. For example, Industrials and Consumer Discretionary sectors saw inventory growth of ~10% y/y during 1H. This could explain some of the weakness in ISM new orders (50.8 currently vs. 64.5 1yr ago), which we expect to pick up as companies work through the inventory build-up. In contrast to manufacturing, services and new economy sectors have held up relatively better. It is worth noting, over the last decade the US business model has shifted away from cyclically sensitive manufacturing to higher-margin services. Global central bank easing should help support and extend the cycle. The benefits of easier monetary conditions and substantially lower rates will likely flow through in the coming months, further supporting already healthy credit/financial conditions. The US is a consumer-driven economy and households remain in good shape. Household leverage (debt-to-disposable income) has declined to 0.84x compared with 1.17x peak during the financial crisis and still remains below the cycle average of 0.93x. The ability to service debt is improving given the collapse in mid- to long-term rates (10yr down 30bps MTD) while wage/disposable income growth remains healthy (~3% wage growth). Lower rates should support consumption with interest sharply lower (i.e., 30yr mortgage rates have fallen by 100bps).
So far, we have seen ~$5 drag on S&P500 EPS from Phase 1 and 2, and could see an additional $2 drag on EPS if partial Phase III is implemented from first-order effects (see Figure 1) and further details in Trading Tariffs report). With assumption that phase III would not be implemented, we think we should be able to avoid an outright earnings contraction in 2H19 and grow EPS next year by 7% to $178 (vs. consensus of $184, +11%). This puts the forward equity multiple at 16.2x, which is in line with an historical average of 16x. On a cross-asset basis, valuation has turned substantially more attractive. S&P earnings yield is at 5.9% while global 10yr bond yield is at 0.59%, yielding a spread of 5.28 (95%-ile since 1985). With central banks globally in easing mode, cash is becoming less rewarding (global cash rate at 0.53%) leaving equities as potentially the only alternative with an attractive yield and long-term growth potential. "
I'm neutral concerning the September 1st tariff deadline. I assign a 50/50 probability on its implementation. While the White House Administration is talking tough on the deadline and its desire to put pressure on China, should the tariffs become realized, the damage will resound across the globe initially in the equity markets, with little to offset the damage. Compounding declines in equities will reverberate in the consumer and retail sectors as they did in Q4 2018, when the stock market fell some 20 percent. Pushing forward with tariffs would find the world economy transitioning and retrenching in uniformly negative fashion over the next 6 months. While I don't rule out the tariff implementation, with some 3 weeks to go and more headlines to develop, a couple of things come to the forefront in the calculous.
It is likely, already, that "front loading" has commenced! Companies have already kickstarted advanced production runs upon the tariff threat in order to reduce the impact from the tariffs cost on a per unit basis. Remember, the President has offered this tariff batch at a 10% rate, but can ratchet it up to 25% depending on impact. Companies have already calculated this possibility and therefore have likely ramped manufacturing needs and orders for material goods. This advanced ordering and production cycle will not be without its negative impact on profits. This factor is likely why the market would react negatively upon tariff implementation, but also rebound in the weeks and/or months thereafter, assuming the demand from consumers isn't interrupted meaningfully. The negative EPS impact is a known, calculate-able and therefore less concerning under the premise that eventually the tariffs would be removed one way or the other. Investor focus would shift, therefore, from an EPS focus to a sales focus.
In closing out this portion of our weekly Research Report, I ask investors to consider the real possibility of China announcing its decision to forgo trade talks in Washington. These talks are scheduled to take place in September.
Economic Data
Fortunately, there was minimal economic data in the week that was. The bigger data point came by way of a disappointing ISM nonmanufacturing data print. The Institute for Supply Management’s nonmanufacturing, or services, index slowed to a reading of 53.7% in July from 55.1% in June, the slowest reading since August 2016. The index stood at 59.7% in February.
The rate of growth in the services sector continues to cool off. Respondents indicated concerns related to tariffs. Comments were generally mixed about business conditions. One oil and gas industry contact said companies in the sector were cautious given the volatility in oil prices. The separate ISM factory index fell to 51.2 in July, the slowest since September 2016.
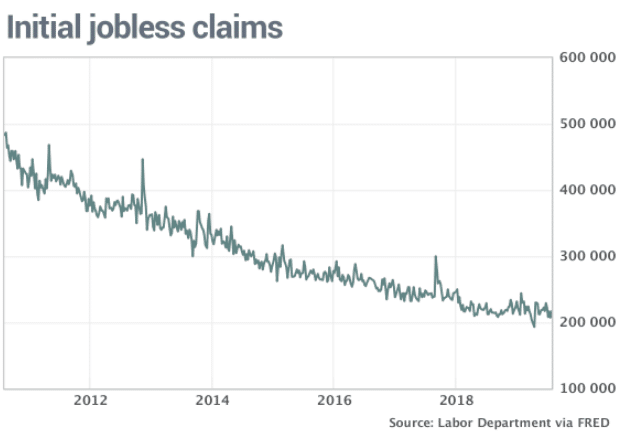
Beyond the ISM data, Initial Jobless Claims continue to paint a positive picture over the labor market. Initial jobless claims, a rough way to measure layoffs, dropped by 8,000 to a seasonally adjusted 209,000 in the seven days Aug. 3, the government said Thursday.
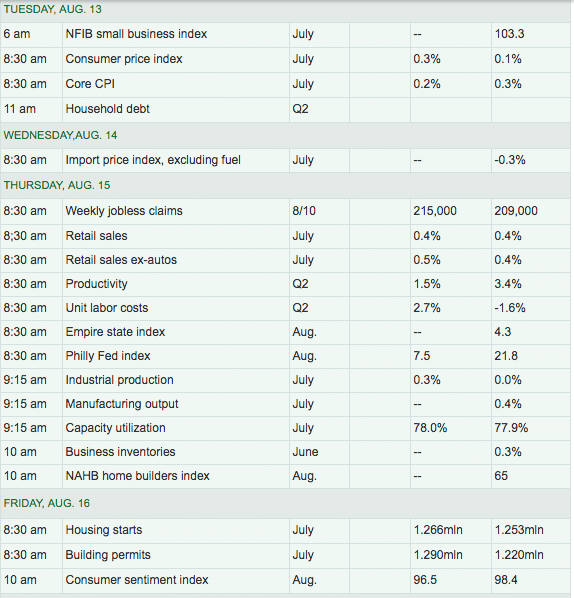
While this past week proved a very light economic calendar docket, the coming week is anything but. Some highly relevant and potent economic data will hit the market come Thursday and gets kicked off in earnest on Tuesday.
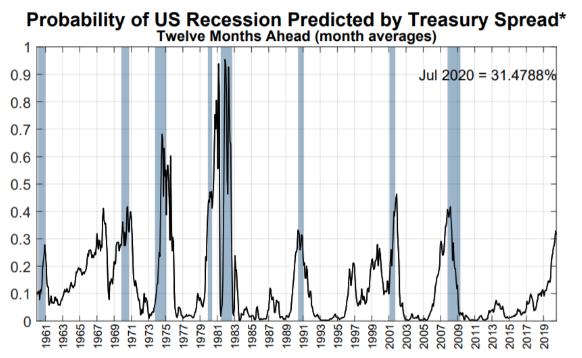
Much of the economic data, the hard data, has been heralding a trend-growth economy. Having said that, the risks to the longest economic expansion cycle in history are growing and remain persistently centered on the trade feud. Many recession risk models/indexes have shown a heightening state of recession probabilities of late. The NY Fed Probability of Recession in U.S. Twelve Months Ahead Predicted by Treasury Spread hit the highest level since August 2008 last month.
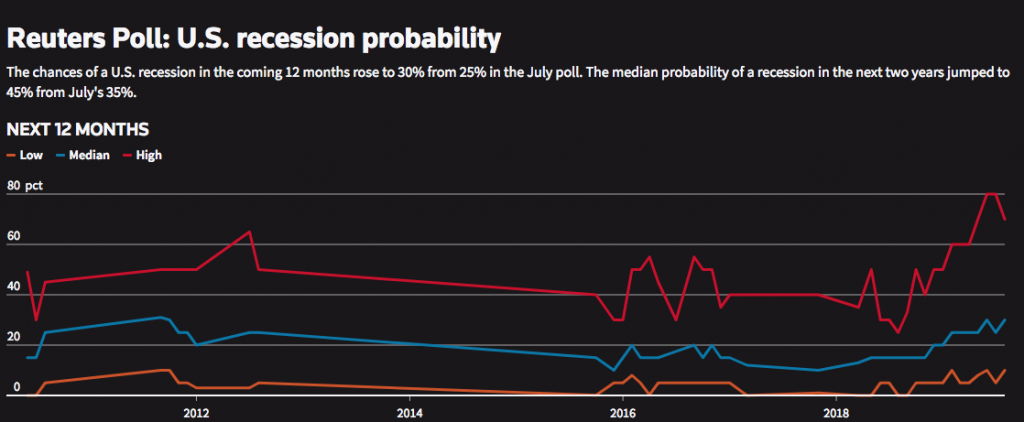
Thomson Reuters most recent survey indicated a heightened state of fear surrounding the probabilities of a recession over the next 12-month period.
"Despite expectations for further easing, the Aug 6-8 poll gave a median 45% probability of the U.S. economy slipping into a recession in the next two years, up from 35% in the previous poll and the highest since that question was first asked in May 2018.
Nearly 70% of economists responding to an additional question said the latest developments had brought the next U.S. recession closer.
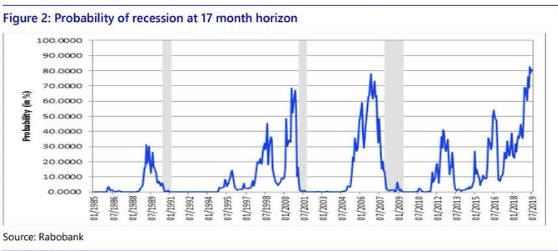
According to Rabobank's recession probability model, the probability of a U.S. recession by December 2020 is 81 percent. This is higher than the recession odds the model spit out in 2000, just before the dotcom bubble burst, and also in 2007, ahead of the housing bubble.
Bank of America Merrill Lynch is also increasingly concerned as they outlined just last week in research notes to clients:
"Our baseline is that this is simply the third mini-cycle in this expansion and that the economy will return to above-trend growth at the end of next year after a soft patch. ... However, we are worried that the economy will not be as lucky this time around for a few reasons: 1) later stages in the cycle - the economy has returned to full capacity and we no longer have "easy growth"; 2) monetary policy tools are limited; 3) there is a persistent external shock hitting the global economy - the trade war - creating high uncertainty across the global economy.
As we have consistently noted, expansions do not die of old age, but they can die from a policy mistake. And we are ripe for a policy mistake today
We now have a number of early indicators starting to signal heightened risk of recession.Our official model has the probability of a recession over the next 12 months only pegged at about 20%, but our subjective call based on the slew of data and events leads us to believe it is closer to a 1-in-3 chance."
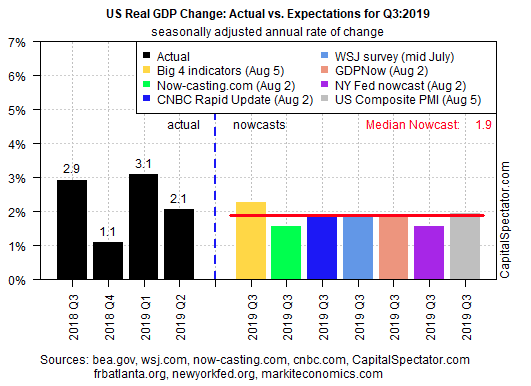
The first look at Q2 GDP came in slightly above economists' estimates at 2.1% growth. For the Q3 period, here is how the various institutions are tracking with their estimates:
The reality is, that even though we should continue to monitor the monthly economic data, it is of lesser importance given the more pressing trade feud and investors' focus on the Yuan. The most important thing for market participants this week will not be the monthly data points, but the daily Yuan fix by China. The PBOC sets the reference rate for the dollar-yuan rate at 9:15 pm ET. The dollar is permitted to trade 2% on either direction away from the reference rate. It rarely does. In fact, last week, when the dollar rose through CNY7.0, the dollar rose 1.8%, one would have thought the sky was falling.
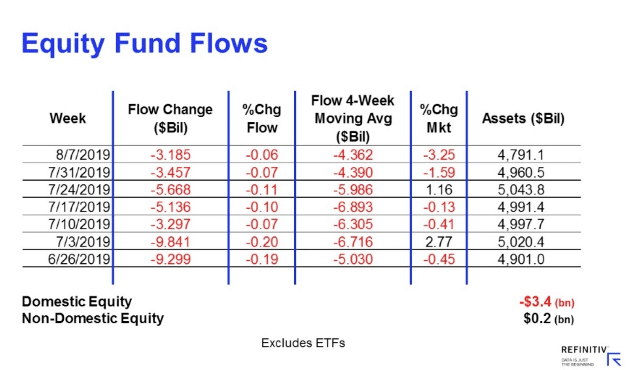
Fund Flows Take A Swing and Wif
According to Lipper Weekly FundFlows report, for the second week in three, equity ETFs witnessed net outflows, handing back a little more than $22.0 billion for the most recent fund-flows week. Authorized participants (APs) were net sellers of domestic equity ETFs (-$16.5 billion), also for the second week in three. Meanwhile, non-domestic equity ETFs witnessed net outflows for the first week in three, handing back $5.5 billion this past week. iShares Core S&P 500 ETF (IVV, +$3.2 billion) and SPDR Gold (GLD, +$1.1 billion) attracted the largest amounts of net new money of all individual equity ETFs. At the other end of the spectrum, SPDR S&P 500 ETF (SPY, -$13.4 billion) experienced the largest individual net redemptions and Invesco QQQ Trust 1 (QQQ, -$3.6 billion) suffered the second largest net redemptions of the week.
I aim to remind investors that while the equity market has seen greater than $100bn in net outflows in 2019, corporate buybacks have more than filled the gap created by outflows. But in the latest recovery period from the 6% S&P 500 decline, who else has been buying the dip?
Using Bank of America Corp. clients as a proxy, it appears to be just about everyone is buying the dip, despite the trade feud concerns.
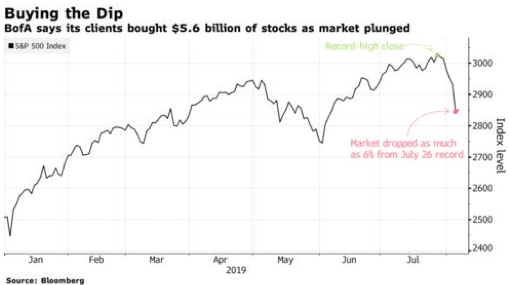
BofAML clients snapped up $5.6 billion of stocks last week as the S&P 500 Index retreated, according to data the bank released Tuesday. That was the second-most in any week since 2008. Institutions drove most of the inflows, though hedge funds and individuals were also net buyers. Companies themselves also continued to move in, with the year-to-date corporate buyback rate holding at 12 percent.
“Flows suggest clients remained optimistic despite the announcement of additional tariffs on Chinese goods and more companies cutting guidance/citing tariff impacts,” BofA strategists led by Jill Carey Hall wrote in a note."
The BofAML data show buying was broad-based across both single stocks and exchange-traded funds for 3 straight weeks, a pattern last seen in mid-to-late May, when the market sold off due to a tariff hike.
In addition to the notes from BofAML data, J.P. Morgan estimates that average buyback activity of ~$3 billion per day likely tripled to nearly ~$10 billion of purchases per day during the August sell-off.
What may also be an encouraging sign for the market ahead, coupled with the bullish long-term technicals, is that corporate insiders have reacted to the stock market’s recent selloff by increasing their purchases.
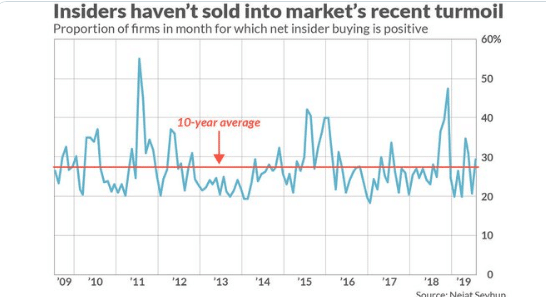
Nejat Seyhun, a finance professor at the University of Michigan who is one of academia’s top experts on analyzing the behavior of insiders, believes that the insiders whose transactions are most worth following are officers and directors. Because the third category of insiders, a company’s biggest shareholders, have not exhibited any historical stock-selection ability, on average. So even though institutional selling has been in abundant evidence this past week, that tells us relatively little about the market’s prospects.
The particular metric on which Seyhun instead focuses is the percentage of firms for which net insider buying from officers and directors is positive. He calculates this by first measuring for each firm whether total purchases from officers and directors in a given month exceed total sales, positive net insider buying, in other words. He then reports the percentage of all firms with insider activity that had this positive net insider buying.
For the first 4 days of August, for example, this percentage rose to 29.5%, according to Seyhun, from 20.7% in July. Seyhun believes the August number is still revealing, indicating insiders’ immediate reactions to the market’s plunge.
“Had they sold into the prices declines, that would have been a bearish signal.”
The August number is encouraging from another perspective as well: It is above the 10-year average, which stands at 27.3%. Seyhun has developed an econometric model that translates a moving average of recent monthly insider buying percentages into a forecast of the S&P 500’s gain over the subsequent 12 months. That forecast currently is for a return of 14.1%, slightly above the stock market’s long-term average.
Earnings Outlook
As it was in the prior week it likely will be for the remainder of the reporting seasons: Earnings continue to come in better than anticipated. This has forced most data tracking and analytics firms to raise their Q2 2019 EPS forecasts. FactSet has raised their EPS outlook from -1% last week to -.7% EPS decline this past week.
To date, 90% of the companies in the S&P 500 have reported actual results for Q2 2019. In terms of earnings, the percentage of companies reporting actual EPS above estimates (75%) is above the 5-year average. In aggregate, companies are reporting earnings that are 5.7% above the estimates, which is also above the 5-year average. In terms of sales, the percentage of companies (57%) reporting actual sales above estimates is below the 5-year average. In aggregate, companies are reporting sales that are 0.8% above estimates, which is equal to the 5-year average.
The blended revenue growth rate for the second quarter is 4.1% today. If 4.1% is the final growth rate for the quarter, it will mark the lowest revenue growth rate for the index since Q3 2016 (2.7%). Eight sectors are reporting year-over-year growth in revenues, led by the Communication Services and Health Care sectors. Three sectors are reporting a year- over-year decline in revenues, led by the Materials sector.
Looking at the second half of 2019, analysts see a decline in earnings for the third quarter followed by low-single-digit earnings growth in the fourth quarter. The forward 12-month P/E ratio is 16.7, which is above the 5-year average and above the 10-year average.
- For Q3 2019, analysts are projecting a decline in earnings of -3.1% and revenue growth of 3.0%.
- For Q4 2019, analysts are projecting earnings growth of 3.9% and revenue growth of 4.0%.
- For CY 2019, analysts are projecting earnings growth of 1.5% and revenue growth of 4.3%.
- For Q1 2020, analysts are projecting earnings growth of 8.5% and revenue growth of 5.6%.
- For Q2 2020, analysts are projecting earnings growth of 9.9% and revenue growth of 6.4%.
In congruence with the raised Q2 EPS outlook from FactSet, Refinitiv has also raised their forecast as depicted below:
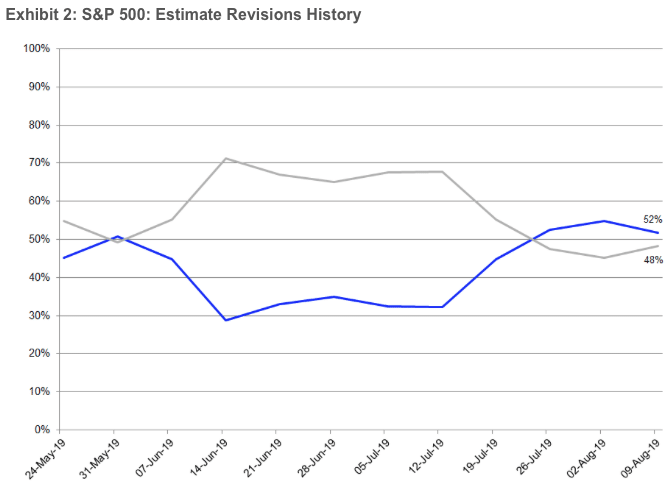
Aggregate Estimates and Revisions
- Second quarter earnings are expected to increase 2.8% from 18Q2. Excluding the energy sector, the earnings growth estimate is 3.5%.
- Of the 450 companies in the S&P 500 that have reported earnings to date for 19Q2, 73.3% have reported earnings above analyst expectations. This compares to a long-term average of 65% and prior four quarter average of 76%.
- 19Q2 revenue is expected to increase 4.7% from 18Q2. Excluding the energy sector, the growth estimate is 5.2%.
Investor Takeaways
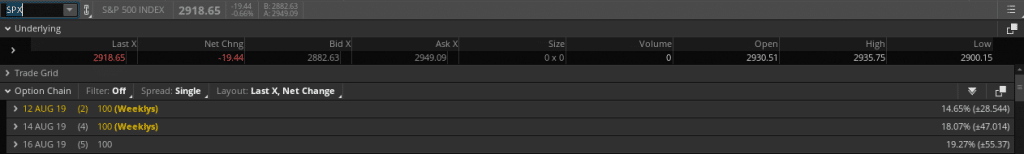
One of the reasons I invite investors and traders to remain cautious and with cash despite the apparent "buy the dip" atmosphere that prevails is because none of the issues we held with respect to the macro picture have improved. Macro conditions have not improved going into the trading week from the previous week. For this week, despite a slight 2% uptick in implied volatility (VIX), the weekly expected move has actually declined. Traders are anticipating less volatility in the week ahead with a $55/point weekly expected move for the S&P 500. Keep in mind, with the VIX at roughly 18%, that equates to a daily S&P 500 move of nearly 1.3 percent.
(Click on image to enlarge)
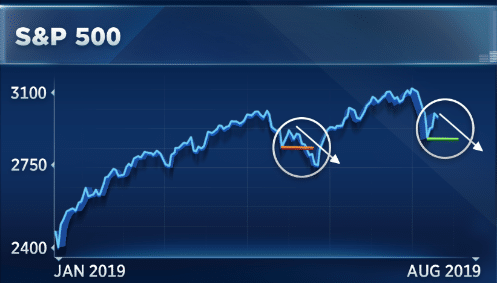
Secondly, the market likes to revisit the scene of the crime, as they say. Market symmetry finds levels revisited quite often and gaps filled along the way. History tells us that whenever there is a sell-off on a short-term basis that is in reaction to new news, the bottom we see on the initial sell-off is rarely the ultimate bottom. The market tends to bounce a little bitand then roll to lower-lows before completing the distribution phase.
I remain of the opinion that the market may express some more near-term pain, but over the long-term, it should rebound in the months ahead. The Fed remains supportive and balance sheets at both the household and corporate level are quite healthy. Should economic policy not shift in a more macro-economic friendly manner ahead of the market declining, the market will likely enforce a policy shift thereafter.
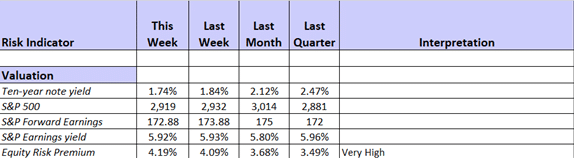
As we've focused a good deal of time and effort discussing the ramifications from the trade feud all year long, we aim to also suggest the risk to capital remain less than one might expect, given the equity risk premium calculation. As bond yields have declined, the yield from the S&P 500 has broader appeal from a risk perspective. The ERP is extremely high presently.
It remains to be seen how the September 1st risk event plays out. There is still ample time for cooler heads to prevail. Should we see ramping of Huawei rhetoric we would suggest this may be the Administrations "tell" that they would be willing to make concessions on Huawei rather than go through with the last batch of tariffs. The Administration really can't afford to risk a greater population of voters based on what we can see happening to farmers across the midwest. Bailouts don't make farmers whole!
The White House Administration is preparing for Farming industry fallout with new interventionist measures (bailouts and changes to bankruptcy law) that will hopefully cushion farmers from retaliatory tariffs by China.
Anything can happen to and within the market on any given day and for any given week, but we find the calculous of all the variables mentioned within to deliver opportunity longer-term, even if it takes some near-term pain to deliver said opportunity. Steve Chiavarone, portfolio manager at Federated Investors, says stocks may be in for short-term pain, but sees a strong long-term bull case.
“It will become a great buying opportunity at some point, because President Trump, I think he’ll push this trade thing a little bit longer than most people expect. But still, he’s got the election next year, so there’s going to be a trade truce. I think it’ll probably come later than sooner, but it will come.
A trade deal and other global developments should support major upside in stocks.
We think that global monetary stimulus and stable data here will lead to re-acceleration in the economy and earnings towards the end of the year and the markets can ultimately hit our 3100 target”.
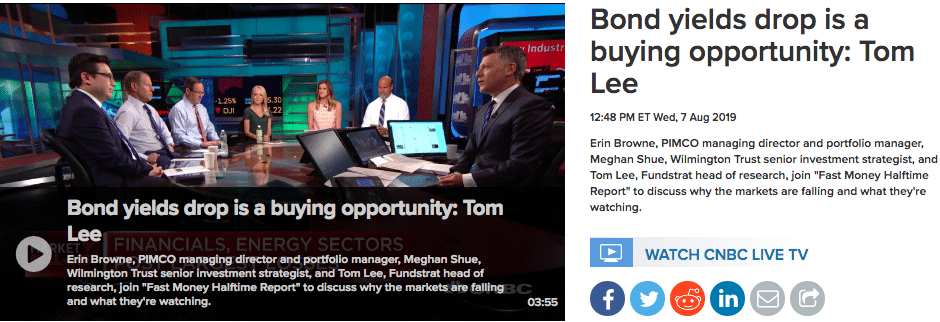
Some strategists and/or analysts are even more optimistic about the present opportunity in the market, pleading with investors to buy this dip, here and now! Thomas Lee, head of Fundstrat Global Advisors, doesn’t feel he can overstate that point, noting in a research report dated Friday that investors “ignore at your peril” bullish signs crystallizing in markets despite jitters about international trade conflicts between China and the United States.
Lee says that there are least 5 signs that have been triggered in the past week that have dependably generated an average return for the market of 12% in the last half of a year.
- Fed made its 1st rate cut and since 1971, mean 6M gain
- The Cboe Volatility Index, known as the VIX, term structure (1M-4M) inverted, last 5 of 7 times was the bottom (see chart attached):
- Daily RSI fell below 30, and 6 of the last 6 saw S&P 500 gain sharply
- 3% 1-day drop is sign of panic, since 2009
- A measure of market sentiment shows that the share of bulls less bears -26, since 1987
The S&P 500 fell 5% over 2 weeks at the beginning of May and rebounded 3% before falling to new lows through the rest of the month. A similar pattern emerged in the fourth quarter 2018. Lee goes on to offer the following to investors:
"IN SHORT, THESE SIGNALS ARE SAYING S&P 500 IS SET-UP FOR A MONSTER 2H RALLY. We are not ignoring the negative signal of a plunge in interest rates, nor saying that a full-blown trade war is negative for the World. But, we believe the trifecta of strong US corporates, positive White House (towards biz) and dovish Fed, are major supports for the US equity market."
Comments
Log in or sign up to join the conversation.