

I was looking at survey-based forecast errors for short-term interest rates when I generated this graph. It’s certainly a humbling picture.
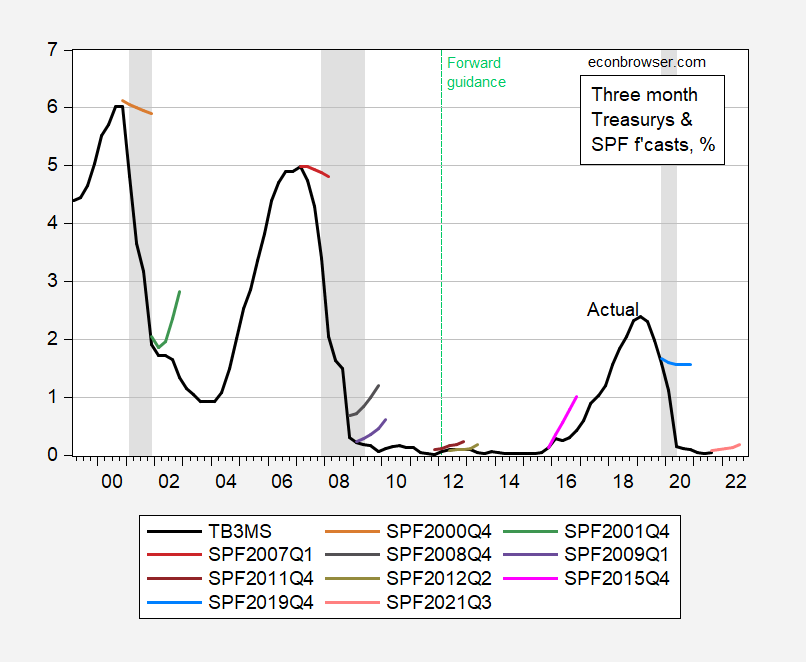
Figure 1: Three month Treasury yields on secondary market, monthly average of daily data (black), Survey of Professional Forecasters mean forecasts from indicated quarters. NBER recession dates shaded gray. Source: Federal Reserve and Philadelphia Fed Survey of Professional Forecasters, and NBER.
To a certain extent, the tendency to project falling rates when interest rates are high, and to project rising rates when they are low, is a reflection of the belief in mean reversion. On the other hand, it’s interesting that even at turning points, consensus views wildly miss the trajectory of short rates.
For forecasts of ten-year Treasury yields, see this post, where a similar pattern is found. However, the 3 month Treasury is closely linked to the Fed funds rate (see Rudebusch for those forecasts), so this outcome is really in a way a reflection of how poorly economists can figure out the Fed’s reaction to developments that themselves are largely unpredictable (meltdown in shadow banking, the Covid pandemic).


Comments
Log in or sign up to join the conversation.