
The pace at which human carbon dioxide emissions are accumulating in the Earth's air fell in May 2026, continuing a long downward trend that began in January 2025. The trailing 12-month average of the year-over-year change in atmospheric CO₂ concentration was 2.22 parts per million.
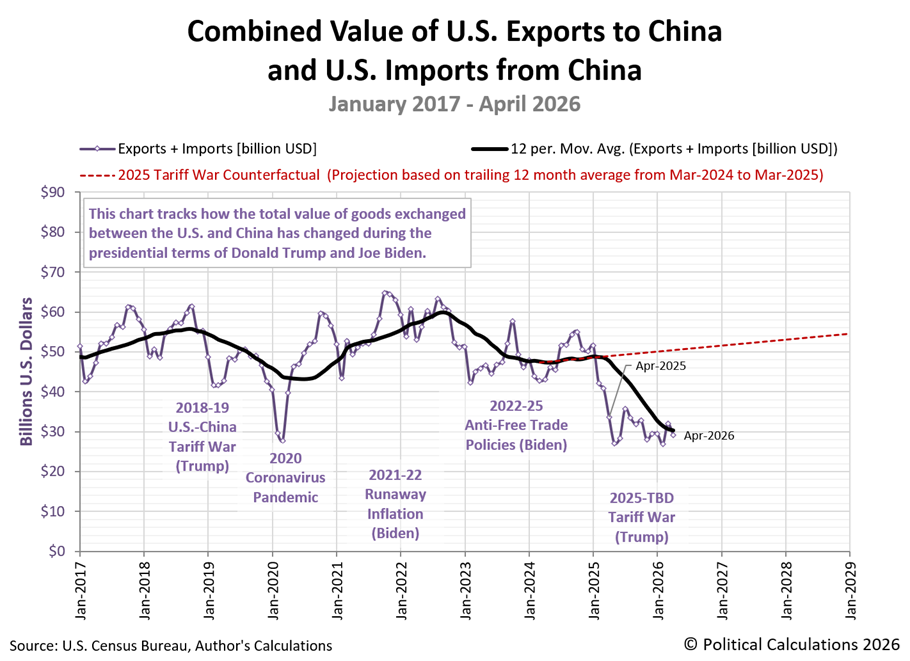
That's a reduction of 1.36 parts per million, or about 38%, from the modern-era record of 3.57 parts per million recorded in December 2024. The change coincided with a sharp slowdown in China's economic output following boosted production aimed at beating expanded tariffs and trade restrictions on the nation's exports. In recent months, newer geopolitical events like the Iran war and its disruption of oil shipping through the Hormuz Strait has also contributed to the decline.
The main impact of Iran war's disruption of oil shipping has increased pressures on nations whose supply of oil originates from Iran and other nations in the affected region. For China, much of that impact has been mitigated by tapping the nation's strategic oil reserves and shifting to alternative energy production methods to offset it. China's lowered economic output from the global tariff war has also reduced its demand for energy.
Similar factors have affected other nations whose oil supplies have been disrupted by the geopolitical event, though their CO₂ emissions are considerably smaller than those of China.
The slowdown is evident in atmospheric carbon dioxide concentration data because China is, by a very wide margin, the world's leading producer of carbon dioxide emissions. The following chart shows how this measure has changed from January 2000 through May 2026:

The following tool gives an estimate of how much economic activity in worldwide (and predominantly in China) has declined since December 2024. If you're accessing this article on a site that republishes our RSS news feed, please click through to our site to access a working version.
The tool's estimates are based on Jenny Cederborg's and Sara Snöbohm's 2016 paper. In their research, they investigated whether there is a relationship between economic growth and carbon dioxide emissions and identified a positive correlation between CO₂ emissions and GDP per capita. They found "CO₂ emissions increase by approximately 0.0002 [metric] tons (0.2 kg) per capita when GDP per capita increase by 1 dollar, holding all other variables constant".
That relationship doesn't take the effects of inflation into account, so the tool's results based upon it are likely understating the real reduction in global GDP associated with the reduced economic activity indicated by the reduction in CO₂ emissions.
That said, global GDP for 2024 is estimated to be around $110 trillion, which means the indicated global GDP reduction of $45.2 trillion since December 2024 is substantial.
References
National Oceanographic and Atmospheric Administration. Earth System Research Laboratory. Mauna Loa Observatory CO2 Data. [Online Data]. Updated 5 June 2026.
Cederborg, Jenny and Snöbohm, Sara. Is there a relationship between economic growth and carbon dioxide emissions? Semantic Scholar. [PDF Document]. 2016.

Comments
Log in or sign up to join the conversation.