
Warnings of an impending pullback from indicators such as market breadth and a slightly positive VIX correlation went unheeded last week as the S&P 500 Index pushed up into new high territory again on Friday after a brief one-day pause on Thursday. Details follow in the Market Review including a look at WTI Crude Oil.
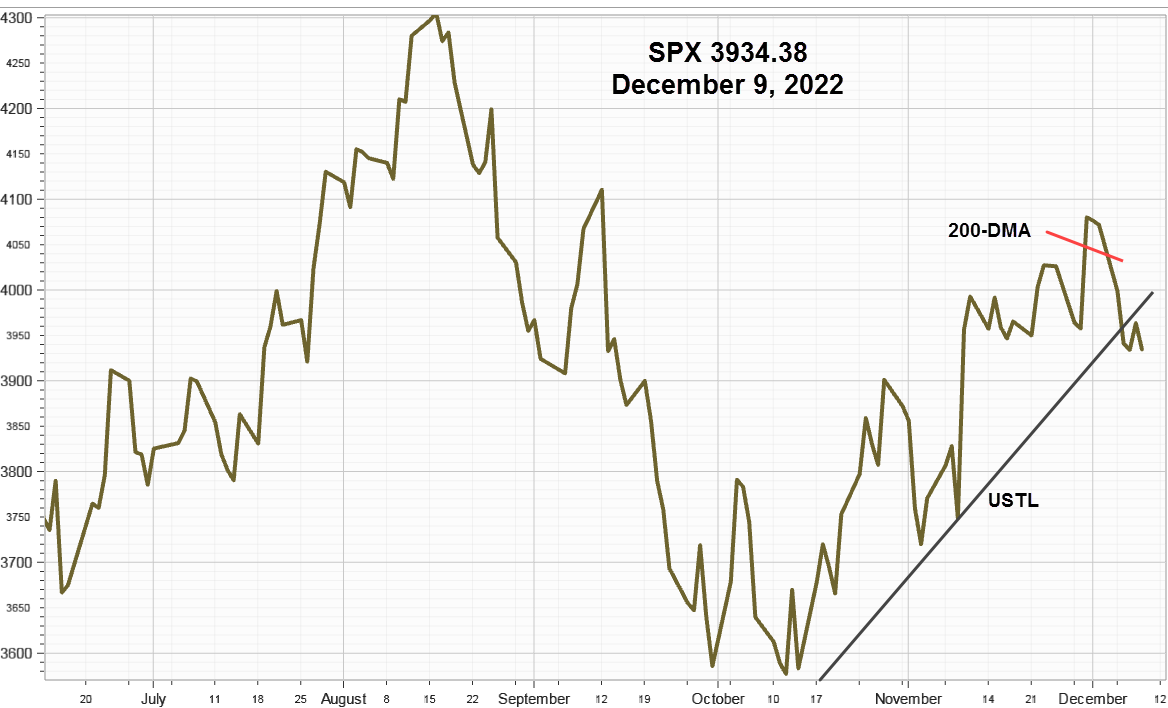
S&P 500 Index (SPX) 4369.55 inched up 17.21 points or +.40% last week after a quick drop on Thursday. For the short four-day week, it made new intra-day highs on three times along with two new closing highs. The operative upward sloping trendline that began at the October 30 low and the 50-day Moving average at 4221.21 should provide support on any unexpected pullback. The big banks kick off second-quarter earnings reporting this week with expectations high compared to last year.
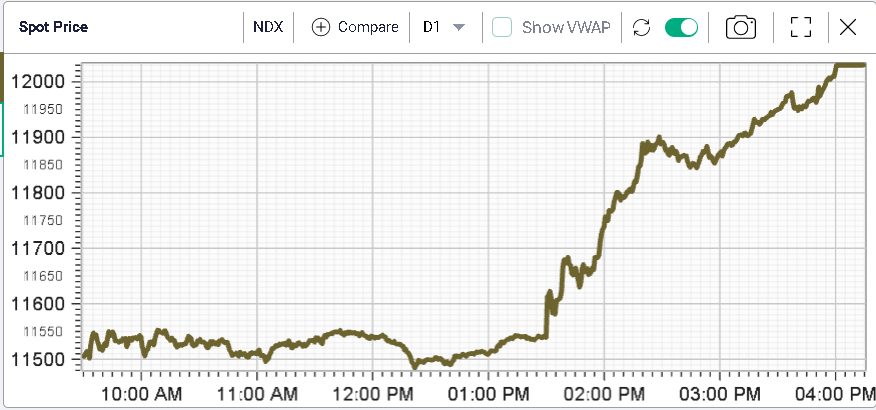
Invesco QQQ Trust (QQQ) 361.01 gained 2.37 points or +.66% last week mostly on Friday's 2.24 point advance. Wednesday it made a new intraday high at 362.76 before pulling back on Thursday. Rotation into secular growth stocks continued until Friday when suddenly cyclicals came alive. Worries about growing Covid-19 Delta variant cases received blame for Thursday's brief decline.
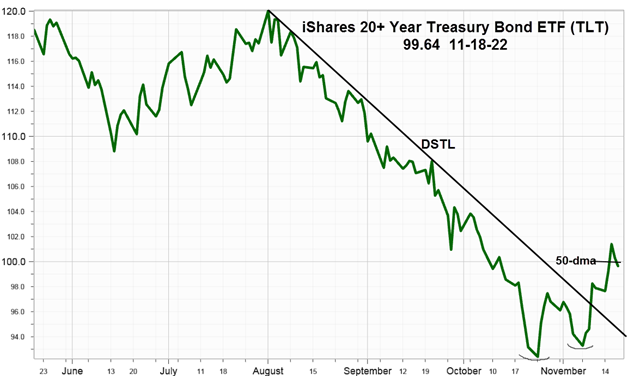
The operative upward sloping trendline that began May 19 at 315.93 contained Thursday's pullback attempt and remains the first support followed by the 50-day Moving Average at 338.53. More tailwind support from a further decline in the yield on the 10-Year Treasury Note helped keep the pullback in check as the yield declined to 1.30% on Thursday before rebounding 7 basis points on Friday to end the week at 1.37%, down 7 basis points from July 2.
CBOE Volatility Index (VIX) added 1.11 points or +7.37% last week ending at 16.18. Our similar IVolatility Implied Volatility Index Mean, IVXM using four at-the-money options for each expiration period along with our proprietary technique that includes the delta and vega of each option, gained .67 points or +6.41% to close at 11.12 % after spiking up to 13.78 on Thursday.

On this SPX chart, Thursday's one-day pullback can hardly be noticed.
VIX Futures Premium
$VIX futures premium ended Friday at 16.31%, still in the bullish green zone, but down from July 2 at 22.22%. The Front-month July contract expires in 8 days on July 21 with the last trading on Tuesday, July 20.

Since most of the volume and open interest are in the two closest futures contracts measuring the volume-weighted premium relative to the standard 30-day VIX provides a good real-time sentiment indicator based upon actual commitments of large Asset Managers and Leveraged Funds. The chart reflects the distance from the VIX to the futures curve computed from the two front-month contracts.
Market Breadth as measured by our preferred gauge, the NYSE ratio adjusted Summation Index that considers the number of issues traded, and reported by McClellan Financial Publications, continued lower every day last week declining 101.12 points or -15.46% ending well below the 50-day Moving Average at 683.54. Since peaking on June 15 at 862.90, its gone straight down with just two brief pauses – a reason for caution.

The alternate breadth measure based on the percentage of S&P 500 Index stocks above their 50-day Moving Average ended the week unchanged at 56% and below a downward sloping trendline from above 90% in April. This reflects greater concentration in fewer large capitalized stocks.
WTI Crude Oil (CL) 74.56 basis August futures ended down .60 or -.80% for the week after making a key reversal when reaching 76.98 on July 6. Cash ended Tuesday, July 6, at 73.37 up .39 for the week shown in the chart below.
In addition to the price chart consider the relationship between near-term and deferred futures contracts, called the term structure.
Normal carry markets, meaning there are cost associated with owing a commodity, such as storage, transportation, and insurance, typically reflect these costs with higher prices in the deferred months. The trade calls this "Contango." However when current demand exceeds supply near term contracts may trade at prices above the deferred months, called "Backwardation" in the trade. So the degree of backwardation can provide a clue about current market conditions. Looking out one year, on Friday the August 22 contract closed at 65.71, lower by 8.85 or -11.87% backward. For comparison on May 14, the difference between the June 21 and June 22 contracts was 4.41 or -6.75%. By this measure, the market is tighter now than in mid-May.
Using the cash price on Tuesdays helps align prices changes with futures positioning reported on Fridays based on the previous Tuesday. On Tuesday, July 6, cash ended at 73.37 very near the highs in the summer of 2018.

According to the CFTC's Disaggregated Commitments of Traders - Options and Futures Combined report, COT as of Tuesday, July 6 "Managed Money" including commodity trading advisors (CTAs), commodity pool operators (CPOs), such as commodity ETF managers, and “hedge funds” reduced their collective net long position as a percentage of open interest from 13.94% on June 22 to 11.96% on July 6, entirely by reducing their collective longs by 32,903 contracts. Chart:

For comparison, a year ago on July 21, 2020, the long position was 16.76%. While the positioning of other participants occasionally correlates well with price changes, Managed Money changes usually give the best information.
The third important indicator compares total open interest to price since open interest needs to keep expanding to sustain price trends both up and down. This Z score chart shows the current relationship.

Notice open interest peaked on May 15, 2018, two months before prices started declining in the summer of 2018.
Currently, open interest appears going sideways and the price continues higher.
Of course, fundamentals like the decision by OPEC+ on production increases and inventory drawdown matter, but futures traders will anticipate and react immediately only to be reported the next Friday.
For now, the uptrend remains in place, supporting the Oil & Gas producer's stock prices in the S&P 500 Index, but Managed Money decided to remove some longs as of July 6.
Strategy
In bull markets, a good strategy is to stay long equities and/or ETFs and then tactically hedge pullbacks as they begin developing since ordinary pullbacks can become corrections when something unexpected happens. Then corrections can become downturns when something else unexpected happens, and downturns can become bear markets when many unexpected things change medium and long-term fundamentals.
While cautiously bullish going into earnings reporting this week. Be aware of "buy the rumor sell the news" for stocks quickly advancing before reporting.
Reasons to consider reducing selected longs or hedging with SPDR S&P 500 ETF (SPY) put spreads include:
Outsized earnings expectations compared to last year.
Erratic daily swings from Risk-On to Risk-Off. Last week seemed unusual enough to stir up thoughts of whipsaw, an odd-sounding market term first experienced and explored way back in July of 2009 shortly after the long bull market began.
Uncooperative market breadth justifies raising the yellow caution flag one notch.
The VXST (nine-day VIX) correlation ended Friday positive at .19 up from -.56 on Tuesday. In the past positive correlation preceded pullbacks.
Summary
Despite selected indicators like market breadth suggesting caution the S&P 500 Index made new closing and or new intraday highs three out of four days last week. Helped again by declining interest rates secular growth stocks in the Invesco QQQ Trust (QQQ) outperformed. After making a key reversal WTI Crude Oil futures pulled back, but the uptrend appears intact. With 2Q earnings reporting beginning this week, watch out for sell the better than expected news.
Comments
Log in or sign up to join the conversation.