
Last week both the Invesco QQQ Trust and the S&P 500 Index followed the a-b-c corrective wave script set up the week before until Friday's COVID -19 news interrupted their advance. Details follow in the Market Review along with some comments about the upcoming earnings reporting bustle about to begin.
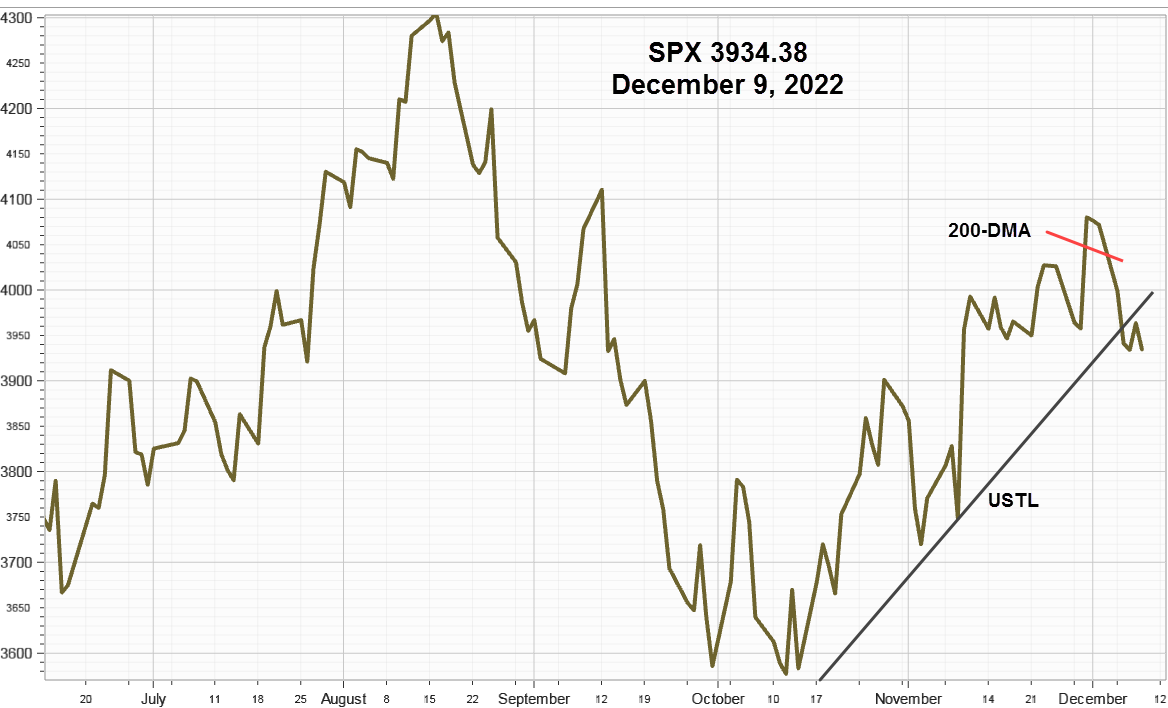
S&P 500 Index (SPX) 3348.42 gained 49.96 points or +1.51% last week closing back above the 50-day Moving Average on Thursday before Friday's untimely reversal. Last Monday's 53.14 point advance confirmed the end of the a-b-c corrective wave that began with the 51.87 point advance on Friday, September 25. Now just below the 50-day Moving average at 3361.60 the next moves early this week will depend on the COVID -19 news over the weekend.
In order to appreciate the end of the a-b-c corrective wave requires accepting the top made on September 2 at 3588.11, as an Elliott 5th wave from the March 23 low, explained last week in the Strategy Section of Digest Issue 39 "U.S Dollar Whacks Gold [Charts]." Elliott Wave, like other technical analysis techniques such as Head & Shoulders patterns, provides a framework for analysis, often they work and sometimes they fail, but even when they fail, they provide useful information.
Friday's upturn, presuming it continues higher this week, will be labeled the end of an a-b-c corrective wave since the top on September 2 at 3588.11, looks like a 5th wave top from the March 23 low. See more the Strategy Section below.
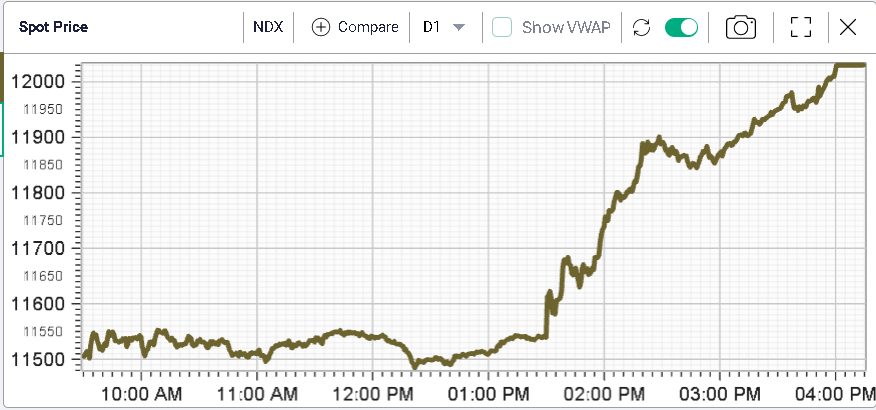
Invesco QQQ Trust (QQQ), 274.31, called "the decider," gained 2.75 points or +1.01% last week closing slightly below and the 50-day Moving Average at 274.84. On Friday when the SPX declined .96%, QQQ declined 2.81%, reflecting an attempt to rotate into selected cyclical stocks from growth that began at the September 2 high. Stay tuned, as it's too soon to tell if the rotation attempt will succeed.
CBOE Volatility Index® (VIX) 27.63 added 1.25 points or +4.74% last week. Our similar IVolatility Implied Volatility Index Mean, IVXM using four at-the-money options for each expiration period along with our proprietary technique that includes the delta and vega of each option, advanced about the same, up 1.26 points or +5.55% ending at 23.95.
Changes to the IVXM and SPX charts below are hardly noticeable.

The 10-day VIX correlation indicator remained in a normal range, ending slightly more positive at -.79 on Friday.
VIX Futures Premium
This next chart shows our calculation of Larry McMillan’s day-weighted average between the first and second-month futures contracts as of last Friday.
With 12 trading days until October expiration, the day-weighted premium between October and November allocated 48% to October and 52% to November for a premium of 17.52%, with the volume-weighted version at 17.12%.

As mentioned last week the futures term structure reflects increased hedge positioning with November futures contracts at 32.95, 5.32 points, or 19.25 % above the VIX creating an unusual bubble.
The relationship of the futures curve to the VIX, as measured by the premium, usually makes a good real-time sentiment indicator based upon actual commitments of large Asset Managers and Leveraged Funds. However, until after the November election, this indicator will not likely provide useful timing clues.
For daily updates, follow our end-of-day volume weighted premium version located about halfway down the home page in the Options Data Analysis section on our website.
Foremost Indicators
Market Breadth as measured by our preferred gauge, the NYSE ratio adjusted Summation Index that considers the number of issues traded, and reported by McClellan Financial Publications, stabilized and gained 23.58 points or +391.04% ending at 29.61. Any further gains here will reflect rotation from growth at any price to the broader market and should encourage the bulls if it continues.
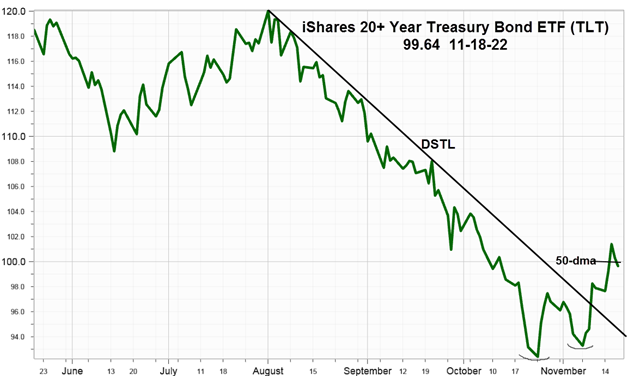
U.S. Dollar Index (DX) 93.91 dropped .77 or -.82%, declining every day except Friday and turning lower well before the measuring objective at 95.25 of the Head & Shoulders Bottom pattern shown in Digest Issue 39 "U.S Dollar Whacks Gold [Charts]," suggesting the previous advance that set off the pattern was related to temporary weakness in the euro due to COVID -19. Gold, silver, and copper bulls began wondering if they should take another look.
Strategy
As earnings reporting begins soon, the game of lowering expectations so companies can score a "beat" and drive their stock prices higher continues. Wall Street analysts are less concerned if the report is good or bad, they are only concerned if the results are better than, or fall below consensus estimates. Companies win the higher share price game by delivering above consensus numbers along with upbeat commentary. Unless interrupted by an unexpected macro event, the typical earning cyclical pattern shows two months up followed by one month down before the next quarter reporting begins. Last quarter makes a good example, up until the island top on June 8, pulling back until June 29, then up and away until September 2. Now as third-quarter reporting begins, both the QQQ and SPX are ready for another round.
As for the SPX after a brief COVID -19 delay, it should continue higher this week, so consider removing some hedges. As written last week it will likely advance back up and retest the September 2 high at 3588.11 and then,
- Attempt to form a double top or
- Exceed the previous high, and start forming a potential H&S Top pattern or
- Resume the long-term uptrend.
Summary
Last week both the S&P 500 Index and the Invesco QQQ Trust confirmed the end of a corrective a-b-c wave as both advanced above their 50-day Moving Averages, until Friday when interrupted Covid-19 news. Market breadth improved slightly due to some rotation into cyclical stocks and the U.S. Dollar Index turned lower before reaching the upside measuring objective. Abnormally high November VIX futures relative to the term structure suggests hedging activity related to the election. Since third-quarter earning reporting begins soon watch for typical earnings reporting cycle.
Comments
Log in or sign up to join the conversation.