

Summary
The DXY will peak either today or tomorrow at latest (April 25-April 26, 2019).
PAM will buy 3 tranches of UDN (1X Bear USD ETF). Too bad, there is no 3X Bear DXY ETF.
Robert P. Balan @robert.p.balan Leader Apr 25, 2019 1
GOOD MORNING
Here is the Market Report At The Chat, April 25, 2019
Forex
@all
The DXY will peak either today or tomorrow at latest (April 25-April 26, 2019)
PAM will buy 3 tranches of UDN (1X Bear USD ETF). Too bad, there is no 3X Bear DXY ETF.
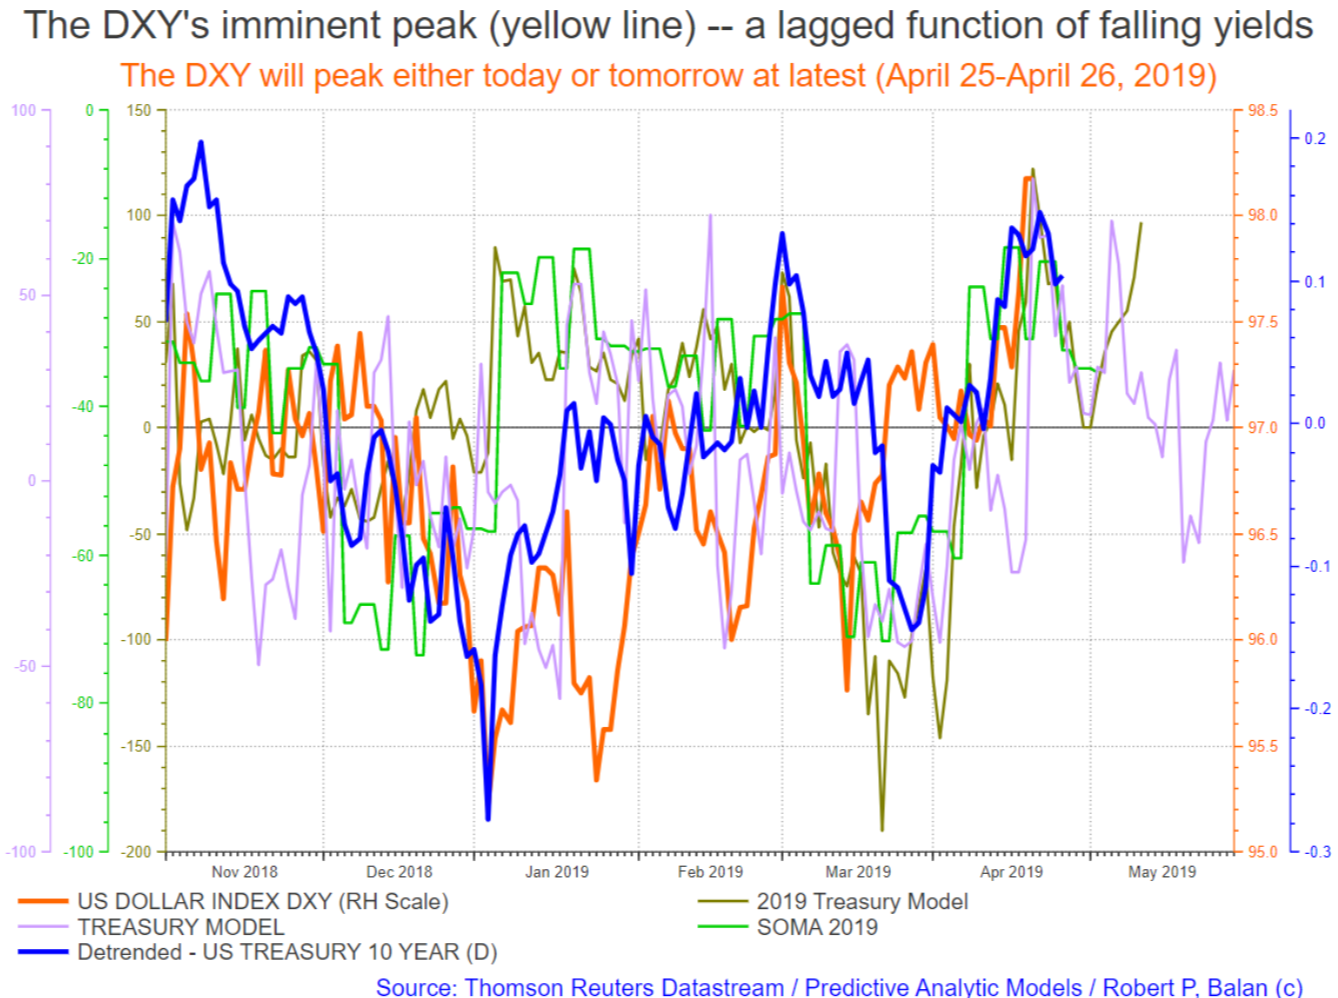

We all have been tracking this top in the DXY (see chart above), which should correspond to the rolling over of the bond yields several days ago. Not only that, the DXY is also hitting a “nested” peak of liquidity factors which precipitated a sharp turn-around in yields.
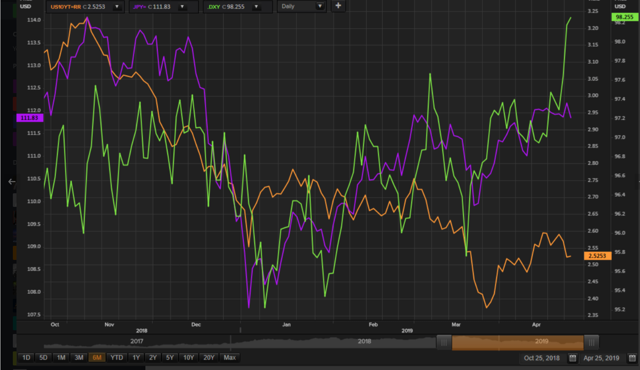
USD/JPY started the ball rolling with regards to a US Dollar peak. USD/JPY develops like the US bond yields (after all, it is even more sensitive to financial risk than the bond yields). Therefore, the turn-around in USD/JPY, along with the decline in yields which started three days ago, tells us that the asset risks will soon be repriced. That does not bode well for the DX and the USD component of USD/JPY. Yen will strengthen if a repricing occurs, and USD will fall in the USD/JPY currency pair.
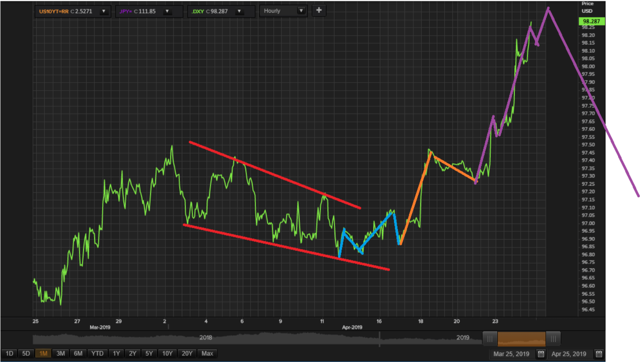
The surge in the chat above is an extended fifth of Elliott wave 5 blow-off. It is not sustainable. The DXY will get repriced sharply.
Apes Wearing Pants @apes.wearing.pants Apr 25, 2019
Robert, can you help me with this.
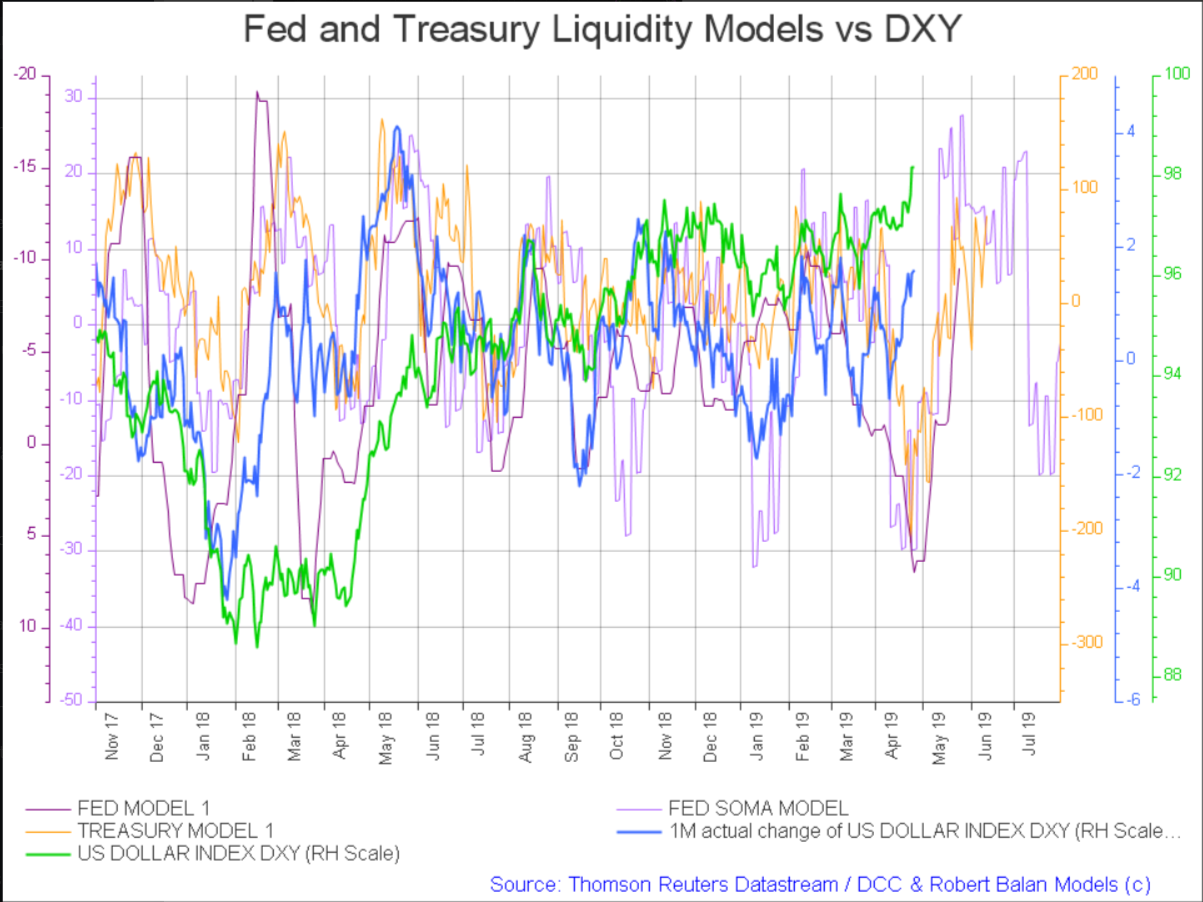

Does this chart not say the opposite? Base for a week then move higher?
Robert P. Balan @robert.p.balan Leader Apr 25, 2019
Apes, here is a close up of the same chart
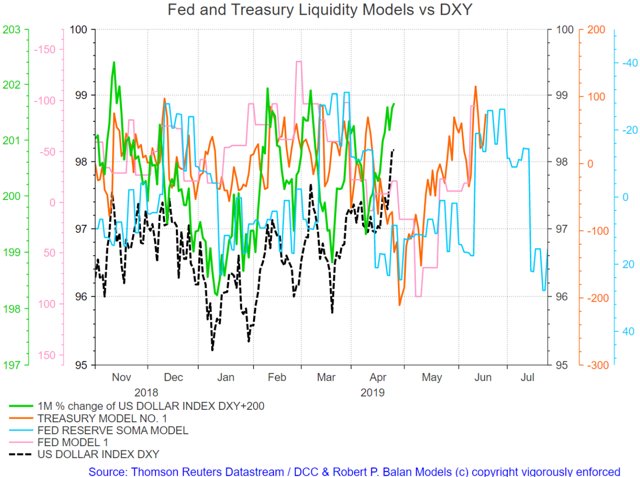
It is actually two weeks consolidation lower and then another, stronger rise in DXY.
Here is the timetable.
Yields may bottom optimally May 3.
DXY bottoms circa May 10, lags behind yields by 4 trading days. That's what I wanted to show in the previous chart, which were Yield charts with the DXY juxtaposed.
Apes Wearing Pants @apes.wearing.pants Apr 25, 2019
Ah ok, thanks!
Robert P. Balan @robert.p.balan Leader Apr 25, 2019
I should stop doing that, or else explain it well. You are right in bringing this out. But I wanted to show the covariance model in another way, and in fact I made another one with Gold chart, with Gold in it, and I merely replaced DXY with Gold and had it shown in inverse.
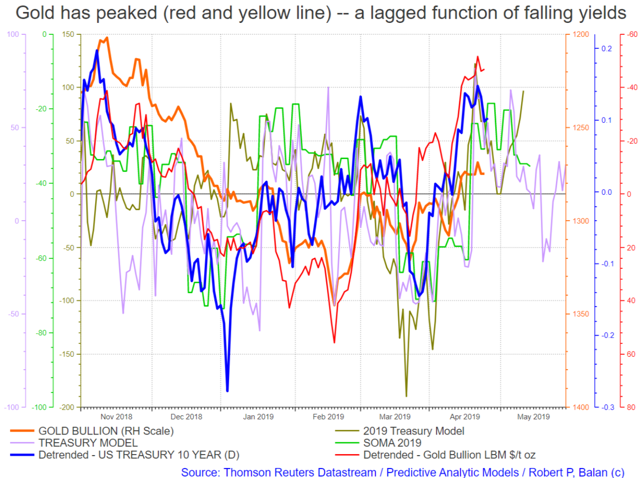
(Text should have said “gold has bottomed . . .”)
You see that Gold has already bottomed, and that was the reason why we went long Gold two days ago. A more sustained decline in yields will puh Gold higher. And if equities also fall at some point as we expect, then Gold will become a safe haven destination again, along with US bonds and the Japanese Yen.
Here is the rest of the chart series, this time with SPX and the 10Year Yield.
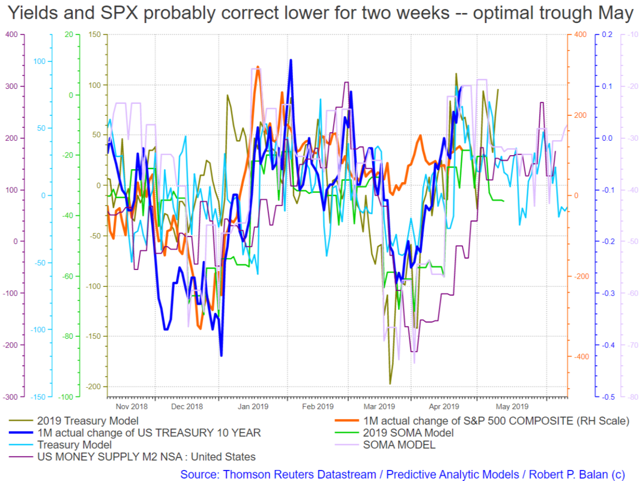
If you are getting the impression that yields have a significantly better correlation with liquidity flows, you are absolutely right.
Yields, already in the form of first difference, can compare with liquidity flows data, which by definition are already first differences. Equity data need to be converted to first difference format before a point-to-point comparison can be made. Then we have to make an extra step of converting first difference values into nominal values.
It should be no problem if equity prices are synchronizing with yields. We can use the direction of yields as proxy of equity direction. But sometimes they diverge – even go opposite ways – and that can be very complicated situation when you try to fit these divergent data into the structure of the liquidity models.
Tracking the forthcoming risk repricing
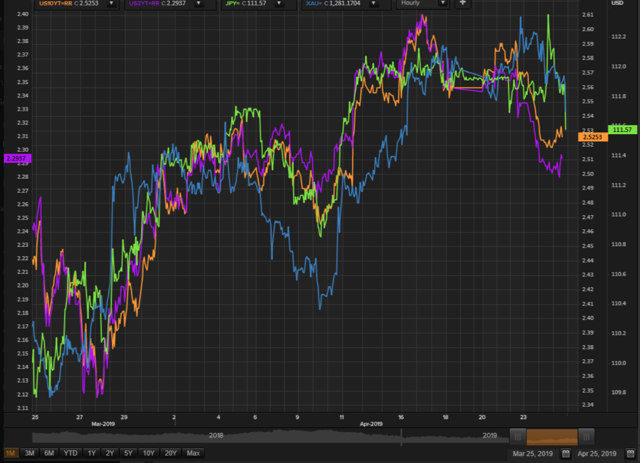
I put together the early warning assets for impending trouble -- gold, USD/JPY and yields. It looks like Yen and gold are starting to get some positive inflows.
Gold is inverted in the chart above, and USD/JPY is falling (Yen is appreciating).
The current sideways trade in the yields should be followed by further declines later in the day and tomorrow. That should be followed by further rallies in gold. The US Dollar (DXY as proxy) will hew to the imperatives of liquidity flows, but will find real impetus to the downside when/if equities get going to the downside.
I put all of these elements in the chart below.

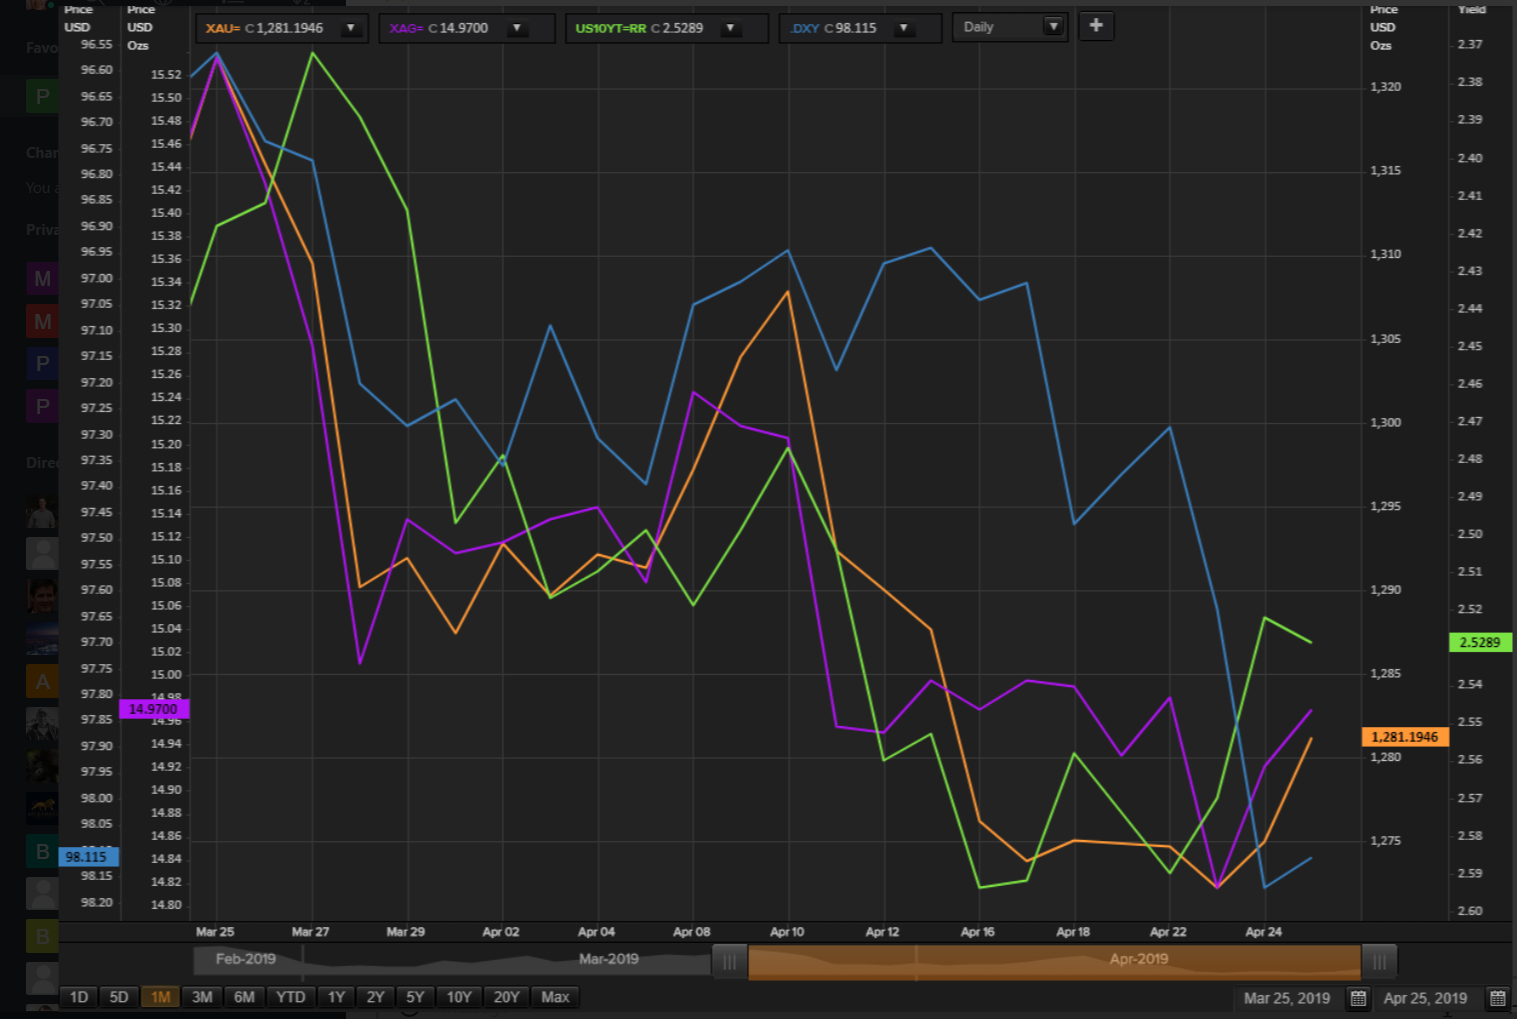
Here is a portrait of the Family Yield. The 10yr yield bottomed up first. A few days later (average: 2 days) Gold turned up. DXY is the family laggard, and should peak today or tomorrow at the latest (back to being laggard by 4 days). If equities start to drift lower, gold will accelerate its rise, and DXY should start to fall.
Equities
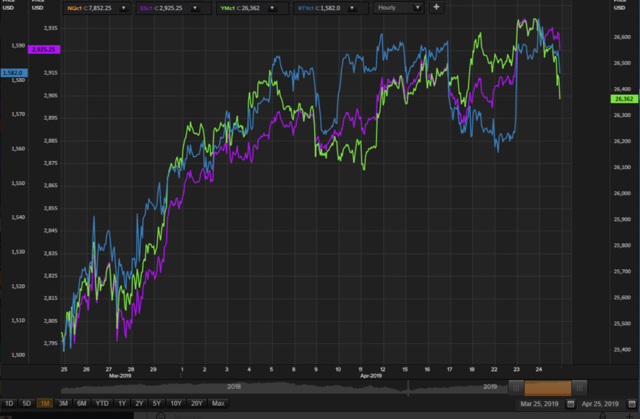
The move lower in equities has been long in coming, but let’s see if the Dow-led move will soon go all the way to the brink, which is the 26,100 level. If that happens, then perhaps, this is The One.
But even then, we should see a wave 2 test of the top. So even assuming that the Dow mini falls to 26,270 - 26,100 today or tomorrow, the next rally may ratchet back to just below 26,500 -- which forms the right shoulder of a Head and Shoulders style top.
Along with the pointers from the liquidity models, that classic H&S top provide enough rationale for PAM to sell the rest of the leveraged equity bear ETFs that are waiting for the right signal from market development.
Copper
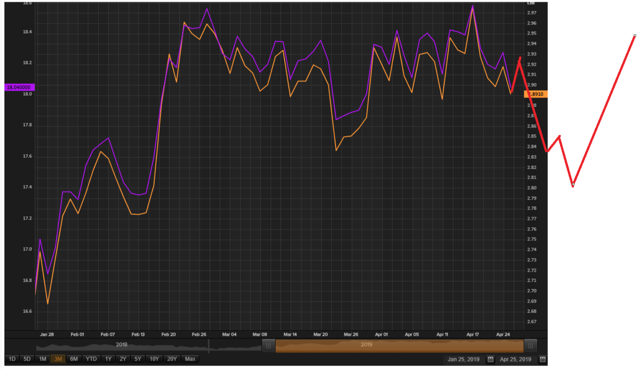
Copper maybe tracing out a simple Flat correction, with an uptick tomorrow. If it does that, PAM will look for a leveraged bear copper ETF to sell. Too tempting, so PAM won't pass over this chance.
Crude oil and Gasoline
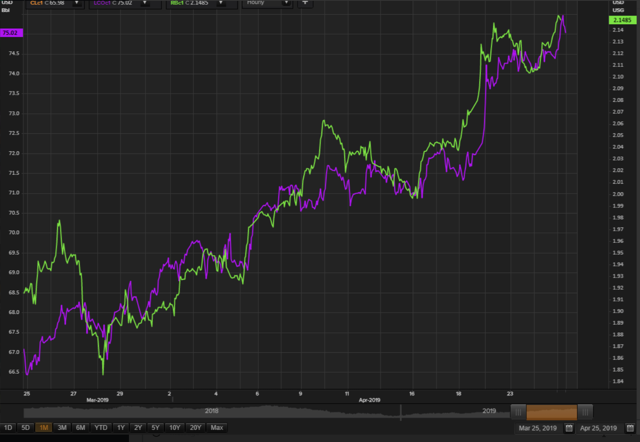
Oil and gasoline need just one teeny bit of push to complete the small degree fifth wave of five. We are probably looking at a top today or tomorrow, as well. And if equities do fall over the next couple of weeks, then we should see oil price responding to it, and oil and E&P ETFs should also be notched down, probably hard.
There is a very significant positive covariance between equities and oil prices, and that endures because of the behaviour of Money Managers (aka Hedge Funds). There is talk that many HFs are leveraging their paper profits from equities to fund bets in crude oil and energy stocks. That has been a common practice by HFs in the past. It also creates a dangerous link between equities and oil pricing once something breaks. It the first to break is the equity side, then the oil bets are going to be in trouble as well. But if the oil price breaks first, which is more likely, given the oil presentation we show below, then maybe there is no contagion.
Tim Kiser (my partner at PAM) and I have just been talking about these following charts that define the crude oil situation a present.
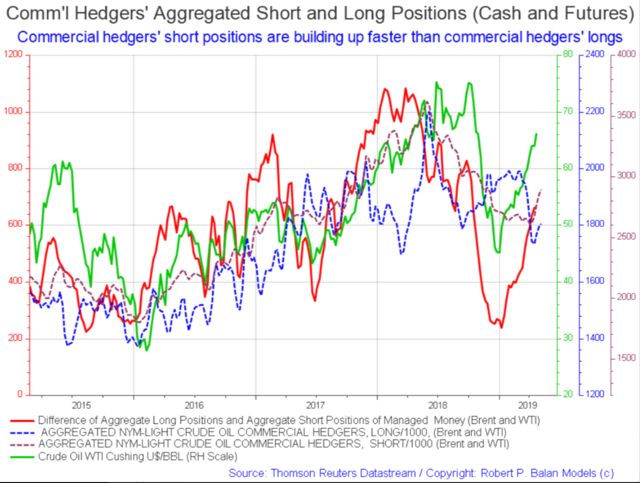
The Money Managers (HFs), forever trend followers, are piling into oil. That is obvious from the behaviour of oil rallies which have defied fundamentals for the past several weeks now (as illustrated in the following charts, below).
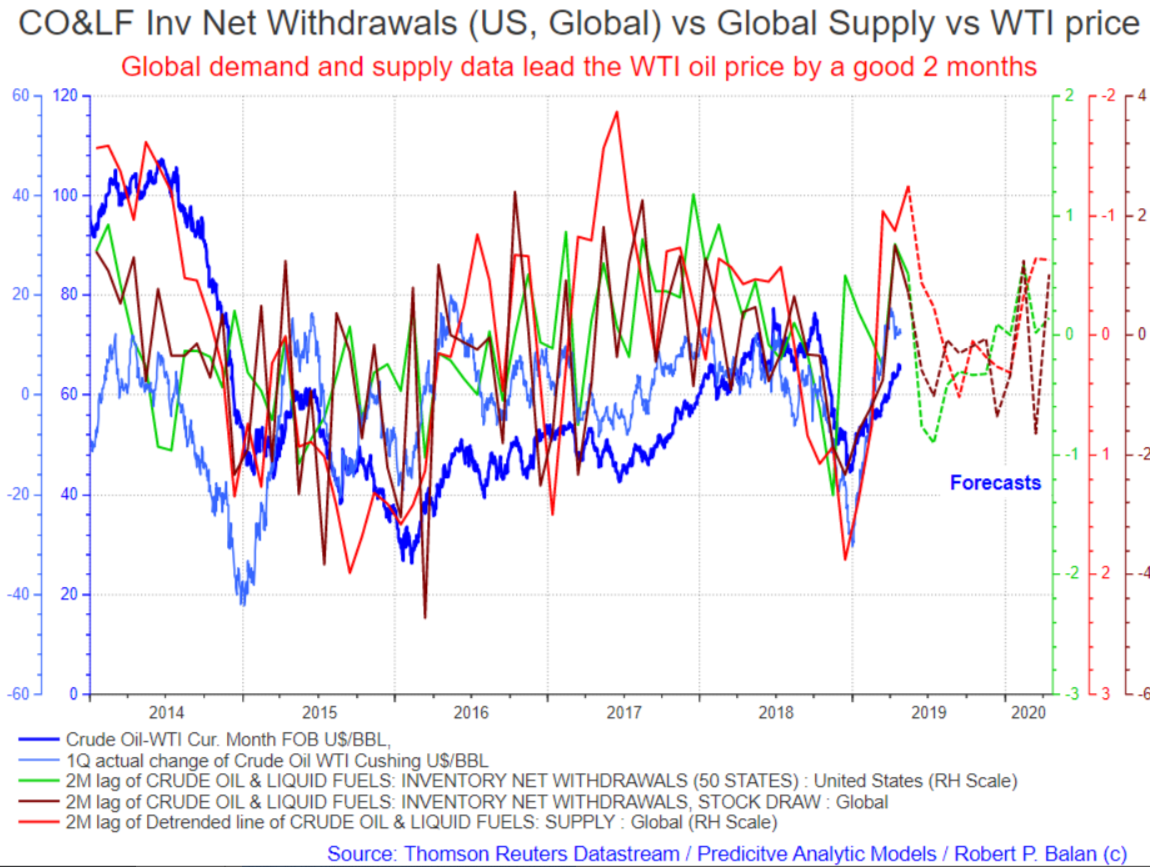
Here are some details on the chart above:
The quarterly change in oil price has turned lower. That is not yet seen in the nominal price, but the cash price of oil should emulate the turn lower very soon.
Global demand actually peaked two months ago (in February) and demand has already been ACTUALLY lower since then (solid lines).
EIA forecasts that March is the low point in global production and supply will significantly rise until July.
Net-net, April is the high point in the adjusted continuum of global demand, and it lagged, negative impact on the price should last until July.
The similar metric on global supply: the positive impact of lower global output will peak in May, and the negative impact of increasing oil production will be felt in the price until September.
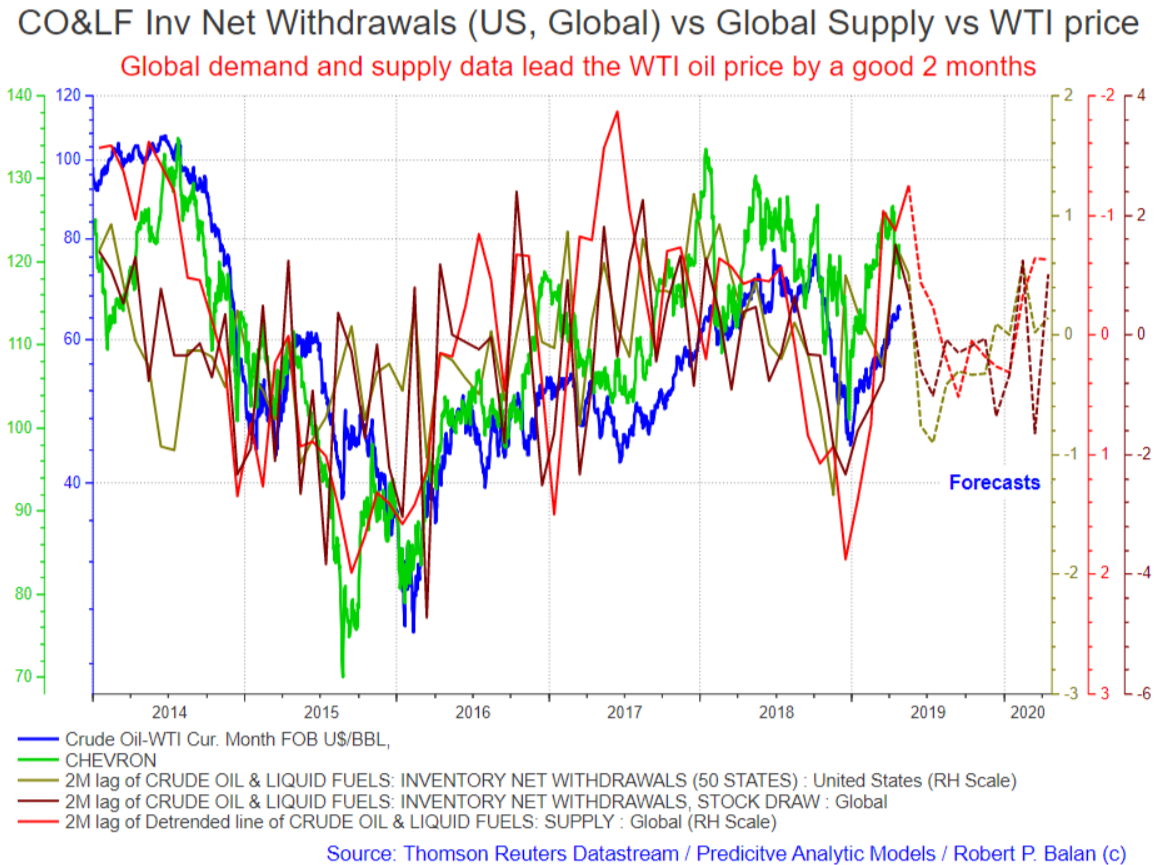
It’s likely therefore that CVX (which was undercut by its take-over of Anadarko) will have a brief upwards rally at some point soon, but the sell-off resumes thereafter and bottoms in July, maybe even in September (see chart above).
Once the monthly change rate of oil turns lower, XOM may be ripe for another short tranche (see chart above). That should come within the next few days.
The PAM’s Big Picture in oil and oil equities is illustrated by the chart below.
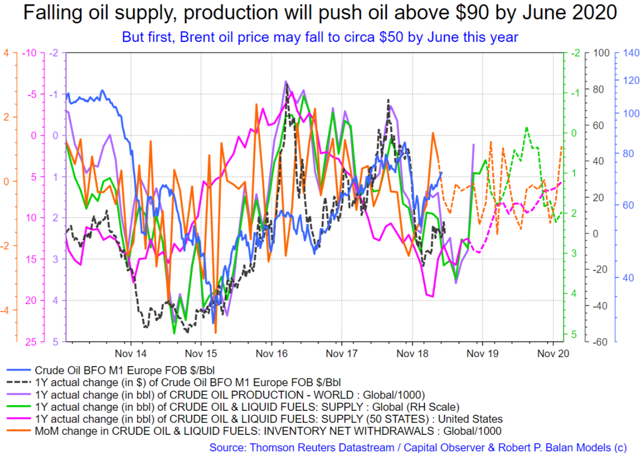
Main points:
The media keep on talking about the supply situation and nary a mention than actual (not forecast, yellow line) global demand has already fallen sharply since February.
Demand is expected by EIA to keep on falling until next month - June, and then stay flat for the rest of the year.
However, the impact of production shortfall in Q1 this year (plus the tightened oil supply) will combine to push prices sharply by July, and probably deliver at least a $90/bbl price by Q2 2020.
Robert P. Balan @robert.p.balan Leader Apr 25,
@all
I believe the UDN is underpricing the DXY -- PAM will now buy 3 tranches of UDN
20.51
I just uploaded this email:
Alan Longbon @Alan.Longbon Apr 25, 2019
Another idea is to go long the Euro where one can get some leveraged ETFs as well, or too risky?
Robert P. Balan @robert.p.balan Leader Apr 25, 2019
Alan Longbon: EUR is fine. It’s just that we have currently positions in EUR as well. I was going to trade EUR leveraged ETFs but decided to use something else. No issues with EUR ETFs Alan.
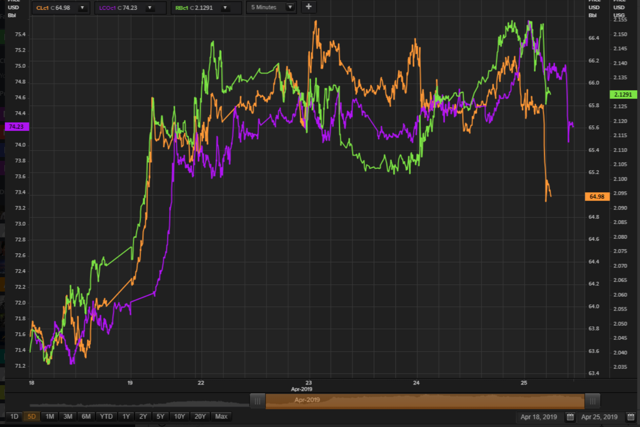
Gasoline and oil prices breaking down into the final hour of NY trading. We did not expect the risk repricing to start first with the energy sector, but we will accept that with grace – we have been waiting for it for a while.
MARKETS CLOSED

Comments
Log in or sign up to join the conversation.