
(Click on image to enlarge)

The hourly chart of the DXY index shows the end of the global corrective trend. This took the form of a triple zigzag consisting of five main cycle waves w-x-y-x-z.
Now, we look toward the beginning of a major bearish trend. This starts in the form of a triple zigzag pattern Ⓦ-Ⓧ-Ⓨ-Ⓧ-Ⓩ. It seems that the sub-waves Ⓦ-Ⓧ-Ⓨ-Ⓧ have already ended.
In the near future, prices will continue falling in the primary wave Ⓩ. Its end is possible near 101.59. At that level, it will be at 76.4% of wave Ⓨ.
(Click on image to enlarge)

Let’s consider an alternative option in which the formation of a cycle triple zigzag will continue.
Most likely, we see a zigzag price movement in the wave z.
The wave z could take the form of a zigzag Ⓐ-Ⓑ-Ⓒ. The impulse wave Ⓐ and the correction wave Ⓑ in the form of an intermediate double zigzag have ended. The entire wave z can complete its pattern near 116.21 level. At that level, it will be at the 61.8% Fibonacci extension of wave y.
The first sub-wave (1), which is part of the primary wave Ⓒ, is likely to reach the level of 107.22, marked by a minute correction.
More By This Author:
The Week Ahead – Bulls Charge In The Hope Of Fed Pivot
Can Central Banks Go Bankrupt? The Perils Of High Interest Rates After QE
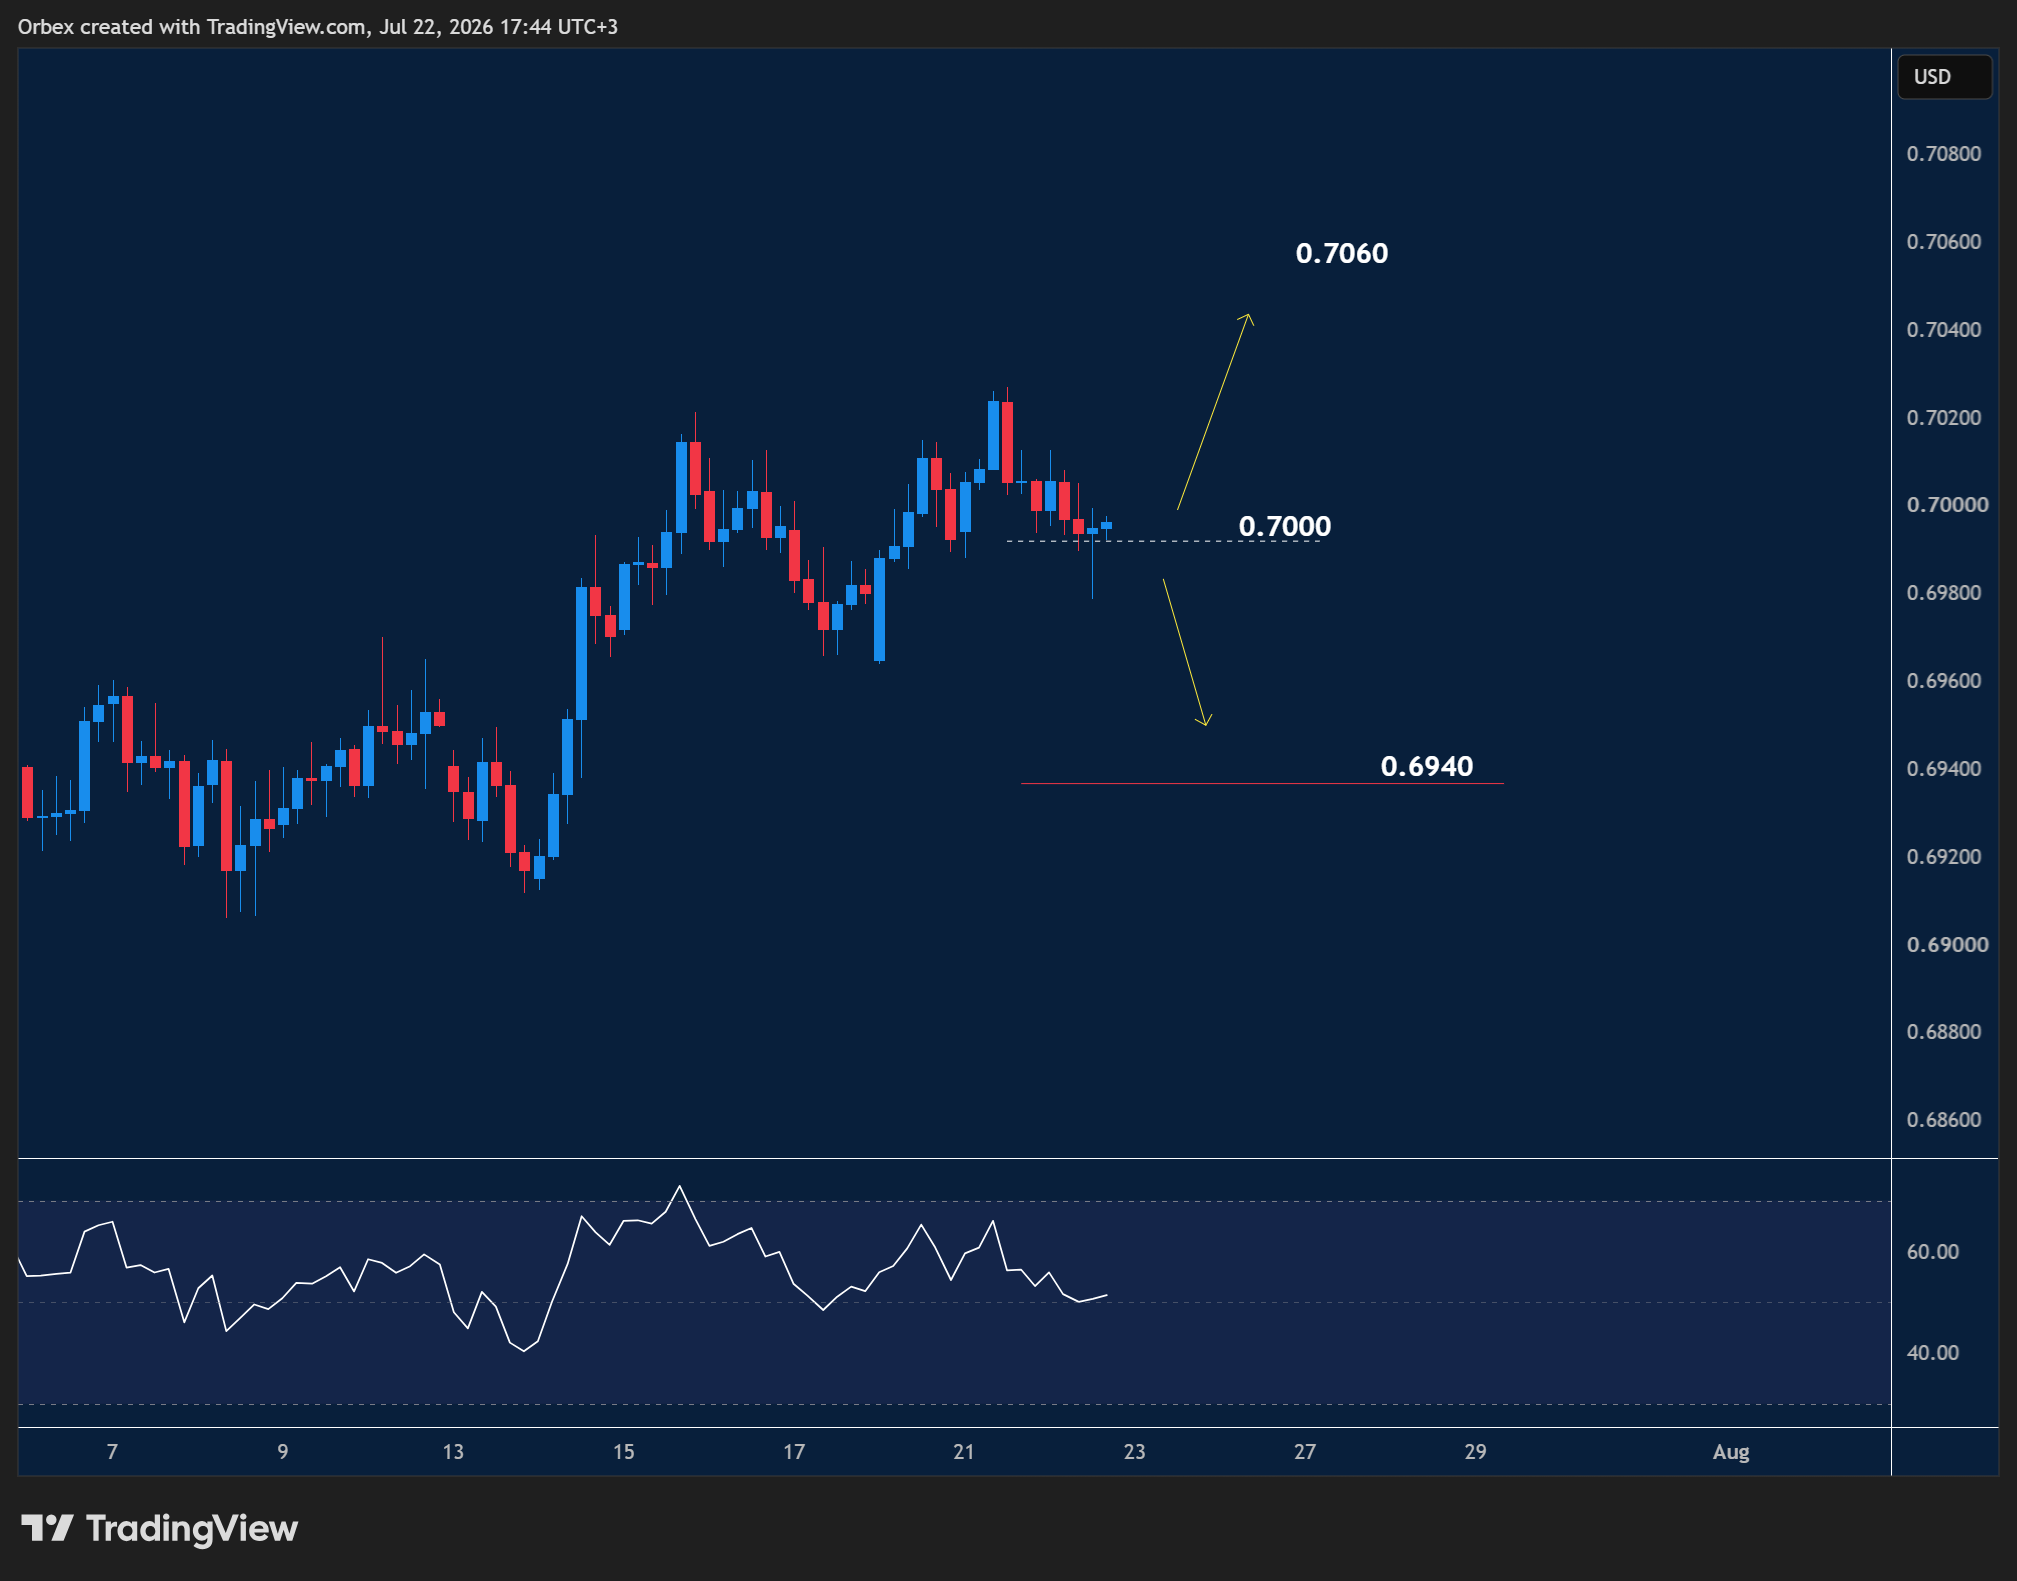
AUDUSD Triple Zigzag Hints At Long Term Recovery

Comments
Log in or sign up to join the conversation.