

The US Dollar (via the DXY Index) reached fresh yearly highs today as traders continue to bid prices higher following Federal Reserve Chair Jerome Powell's two days of testimony on Capitol Hill. With the Fed on the path of gradual rate hikes, markets are now pricing in 25-bps tightening efforts in both September (90%) and December (64%) this year.
But the most notable development over the past few days is not related to the Federal Reserve, but a different central bank: the People's Bank of China. The offshore USD/CNH rate hit a new yearly high itself today, its high exchange rate since July 12, 2017, amid a fresh wave of stimulus by the PBOC.
By using its medium-term loan facility (MLF) to help provide liquidity to banks, the PBOC is essentially rolling out its own quantitative easing program. In effect, the policy loosening effort serves another purpose: it weakens the Chinese Yuan.
While the China-US trade war appears to be morphing into a war of attrition, with both sides racking up casualties and without a clear end goal in sight for the tensions. But by allowing USD/CNH to appreciate rapidly, the PBOC is sending a clear signal to market participants that it intends to use its currency as a tool to buffer the economy from the negative impact of tariffs.
For now, China is winning the currency war, with USD/CNH sitting at its highest level in over a year, and the DXY Index in a similar position. (Yes, winning the currency war means having your currency emerge as the weakest.) A look at the technical picture since early-2017 for the US Dollar reveals that more gains may be coming.
DXY Index Price Chart: Daily Timeframe (January 2017 to July 2018) (Chart 1)
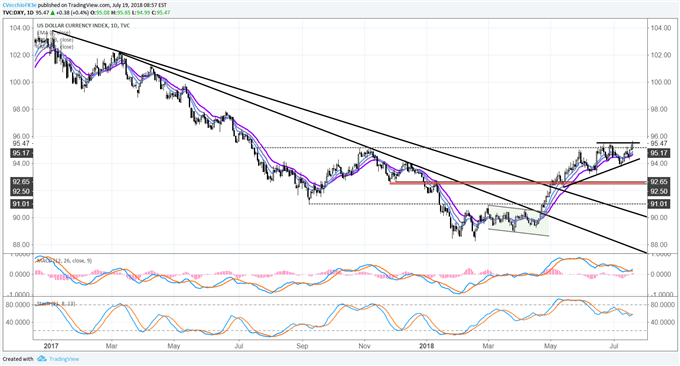
The DXY Index has been clear of both descending trendlines emanating from the January 2017 high as of this past May. Price action since mid-May has been more or less directionless, perhaps a consequence of an overly bullish market seeking a period of consolidation ahead of the next leg higher. The ascending triangle that's been forming over the past eight weeks suggests a continuation effort to the topside is gathering pace.
DXY Index Price Chart: Daily Timeframe (July 2017 to July 2018) (Chart 1)
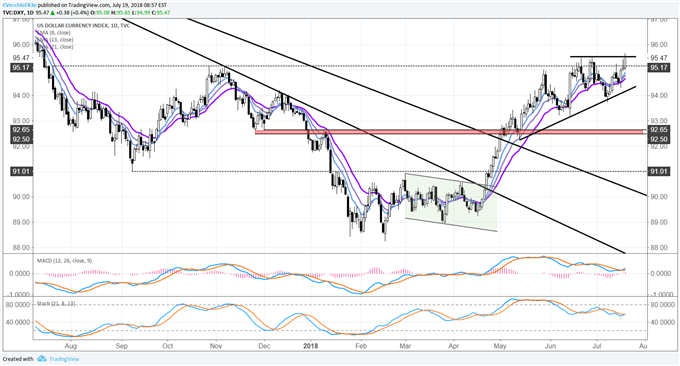
The US Dollar's (via DXY Index) technical posture continues to improve now that price is clearly above its daily 8-, 13-, and 21-EMAs. Both daily MACD and Slow Stochastics have confirmed 'buy' signals in bullish territory after price developments through the first three days of the week.
A breakout resulting from the bullish ascending triangle forming would only be valid given a move through the June 21 bearish daily key reversal and June 27 to 29 evening doji star candle cluster highs at 95.53 - the key level to watch for through the end of this week.



Comments
Log in or sign up to join the conversation.