

The US Dollar (via the DXY Index) is having a strong showing at the start of the full week, now that markets in developed economies are back online after the long Easter weekend. With the Q1’19 US GDP report due out at the end of the week set to show that US recession fears are overblown in the short-term, traders have been bidding up the US Dollar ahead of time, in hopes that this week’s economic data will further diminish the prospect for a Fed rate cut in 2019.
BREXIT BACK IN FOCUS
A week away from the Brexit saga may have been appreciated by market participants, but now that UK parliament is back in session after the Easter holiday week, Brexit headlines are likely to reappear in the newswires over the coming days. UK Prime Minister Theresa May and Labour party leader Jeremy Corbyn are continuing cross-party talks after the European Council has agreed to extend the Brexit deadline to October 31, 2019. Early indications from both Labour and Tory party officials suggest that the talks will result in very little.
GBPUSD TECHNICAL FORECAST: DAILY PRICE CHART (JUNE 2018 TO APRIL 2019) (CHART 1)
(Click on image to enlarge)

Since the bearish outside engulfing bar on June 14, 2018, GBPUSD has spent all but 16 days trading between 1.2660 and 1.3365 – over 92% of the past nine-months within the range. At present time, a triangle has formed since the end of February; today may produce the downside breakdown move. A close below 1.2970 would suggest a more significant setback is coming for GBPUSD prices.
EUROPEAN GROWTH CONCERNS LINGER
Meanwhile, after the European Central Bank’s growth warning last week floated by Reuters, and the realization of those growth concerns with a poor showing by the PMI reports last week, the Euro has been under renewed pressure that the ECB will revise its growth forecasts lower. All of a sudden, there is a strong juxtaposition between the Euro (and its increasing growth concerns) and the US Dollar (and its receding recession concerns).
EURUSD TECHNICAL FORECAST: DAILY PRICE CHART (JULY 2018 TO APRIL 2019) (CHART 2)
(Click on image to enlarge)
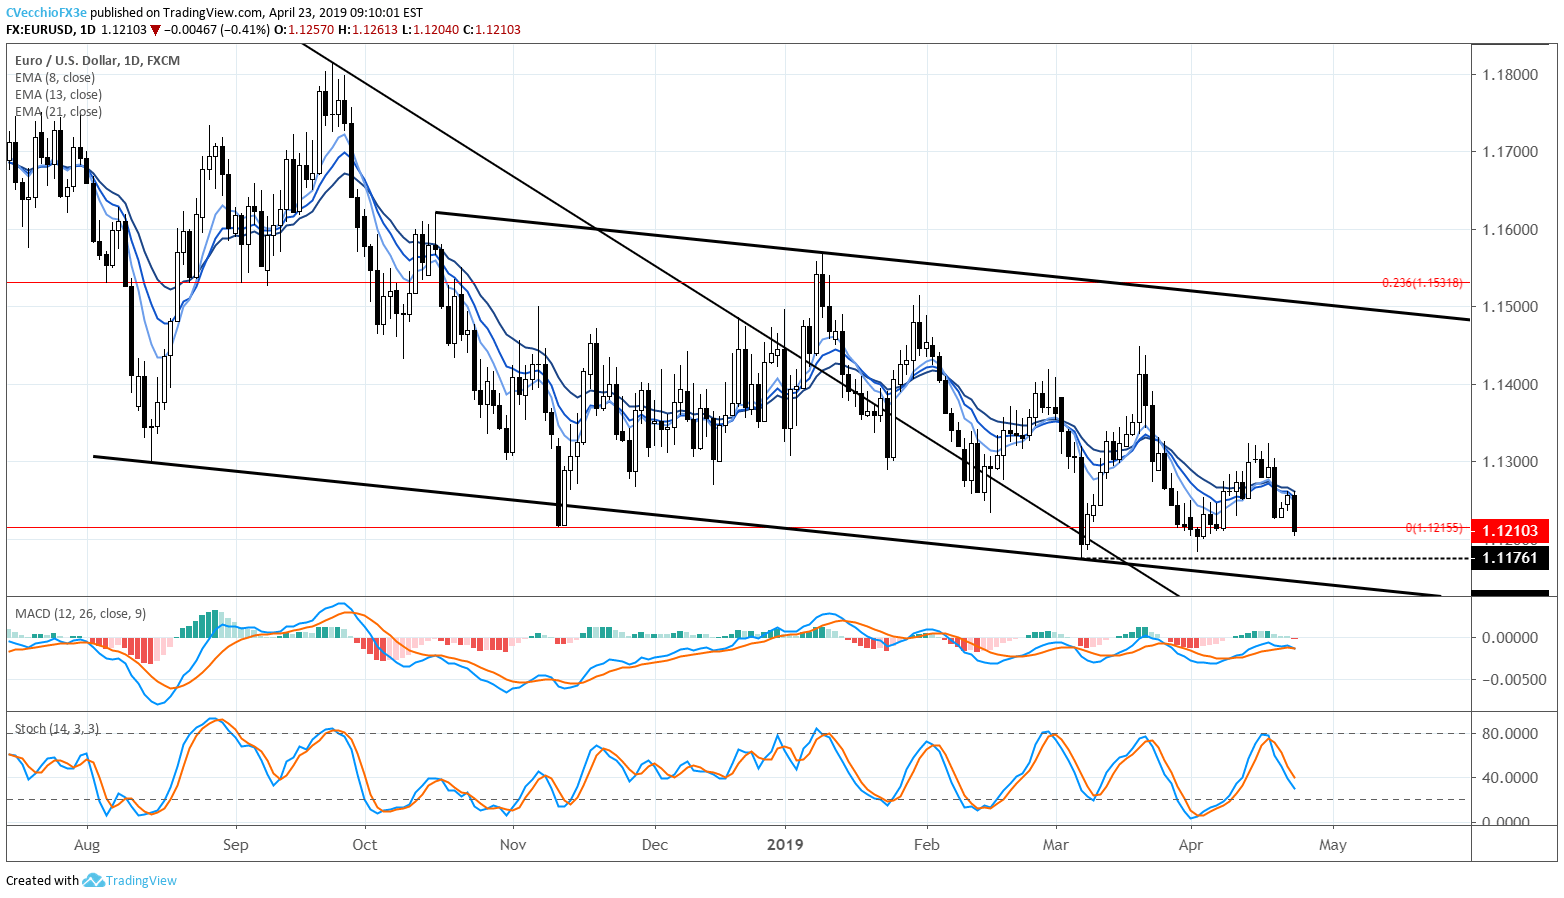
EURUSD rates weakened meaningfully by the end of last week, with the uptrend from the April 2 low busted by the breakdown on April 18. Momentum has started to shift more to the downside, now that EURUSD price is below the daily 8-, 13-, and 21-EMA envelope. Similarly, daily Slow Stochastics have started to swing lower, while daily MACD has narrowed and nearly flipped to the downside.
Given rising European growth concerns, a strong Q1’19 US GDP report could reinvigorate US Dollar bulls and help break out of the multi-month ranges trapping price action. After all, the last six months of trading in EURUSD has been the tightest six-month range seen since the inception of the Euro on January 1, 1999.
DXY INDEX TECHNICAL FORECAST: DAILY PRICE CHART (MAY 2018 TO APRIL 2019) (CHART 3)
(Click on image to enlarge)

Momentum has improved significantly in recent days for the DXY Index, pointing to the increased possibility of a move to fresh highs. Currently, the DXY Index was trading at its highest level in six weeks as well as its highest level since December 2018, when price peaked out near 97.72. With price well-established above its daily 8-, 13-, and 21-EMA envelope, plus both of daily MACD and Slow Stochastics trending higher in bullish territory, the path of least resistance is to the topside for the US Dollar.



Comments
Log in or sign up to join the conversation.