


The DXY Dollar Index price has found support and now is struggling to rebound. A temporary bounce back was somehow expected after the most recent sell-off. However, the pressure is still high, so further drop could signal that the USD could depreciate further versus its rivals in the short term.
DXY moves somehow sideways in the short term. However, a larger drop is far from being confirmed, so we cannot exclude a potential growth towards the weekly pivot point (92.727).
The index needs a helping hand from the US economy tomorrow to stay higher and increase. As a result, the Retail Sales are expected to drop by 0.2% versus 0.6% growth in June, while the Core Retail Sales indicator could increase by 0.2% in July compared to 1.3% in June.
Industrial Production is expected to increase by 0.5% versus 0.4% in the previous reporting period, while the Capacity Utilization Rate could increase from 75.4% to 75.7%.
DXY Dollar Index price technical analysis: Support to safeguard further losses
(Click on image to enlarge)
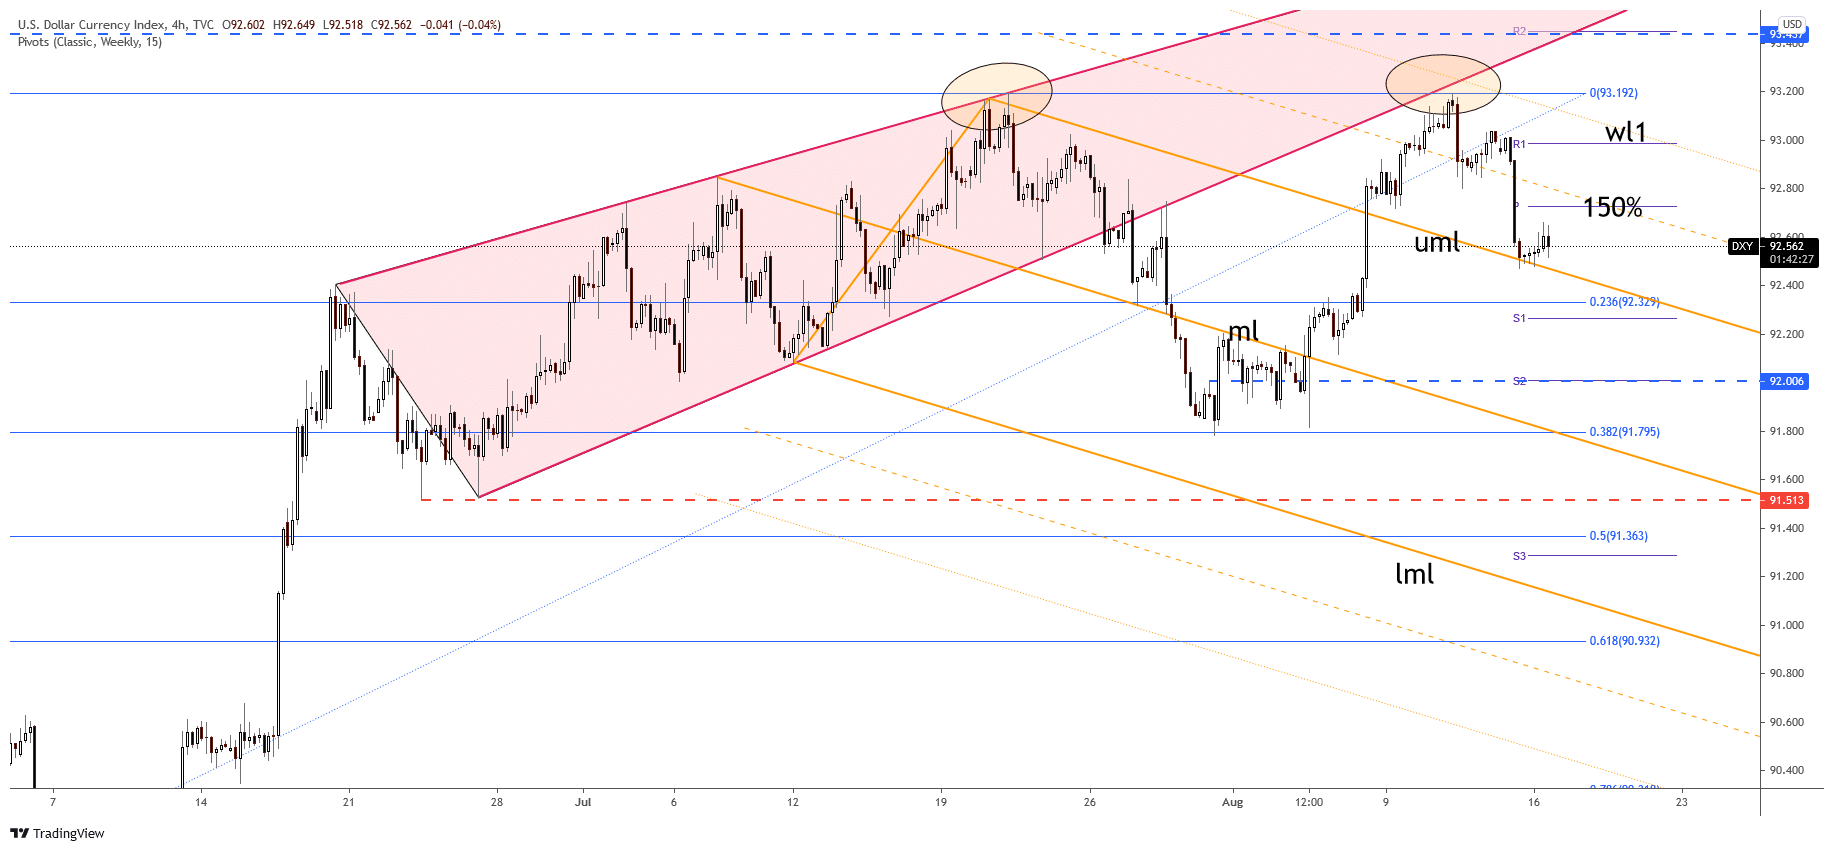
DXY 4-hour price chart
The Dollar Index has found support on the descending pitchfork’s upper median line (UML). However, the weekly pivot point (92.727) and the 150% Fibonacci line are immediate upside obstacles.
Technically, only a valid breakout through these levels could announce an important growth and an upside continuation. The 23.6% (92.32) and the S1 (92.26) are seen as support levels. DXY has printed something like a Double Top pattern.
Still, the reversal formation is far from being confirmed. Only a new lower low, a valid breakdown below 38.2% retracement level, could activate this pattern. So, it’s premature to talk about this scenario right now and as long as it stays above the upper median line (UML).
A temporary consolidation above 92.47 Friday’s low followed by a breakout above the immediate resistance levels could invalidate a deeper drop.



Comments
Log in or sign up to join the conversation.