

Summary
- 100% technical buy signals.
- 14 new highs and up 6.03% in the last month.
- 31054% total return in the last year.
The Barchart Chart of the Day belongs to the Invesco DWA Financial Momentum ETF (PFI). I found the ETF by sorting Barchart's Top 100 ETF list first by the most frequent number of new highs in the last month, then used the Flipchart feature to review the charts for consistent price appreciation. Since the Trend Spotter signaled a buy in 11/18 the ETF gained 12.05%.
The Invesco DWA Financial Momentum ETF is based on the Dorsey Wright Financials Technical Leaders Index (DWA Financials Technical Leaders Index). The Fund will normally invest at least 90% of its total assets in common stocks that comprise the Index. The Index is designed to identify companies that are showing relative strength (momentum) and is composed of at least 30 common stocks from the NASDAQ US Benchmark Index. The Fund and the Index are rebalanced and reconstituted quarterly.
(Click on image to enlarge)
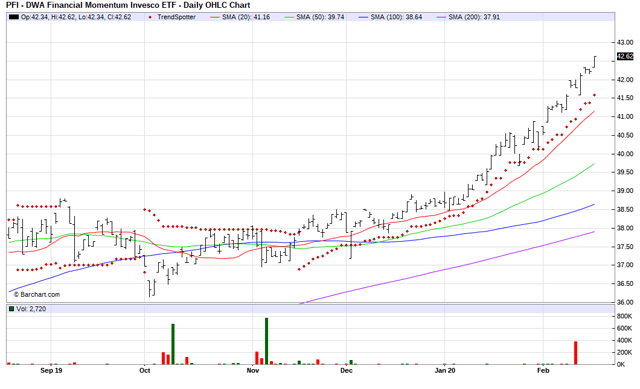
Barchart's Opinion Trading systems are listed below. Please note that the Barchart Opinion indicators are updated live during the session every 10 minutes and can, therefore, change during the day as the market fluctuates. The indicator numbers shown below, therefore, may not match what you see live on the Barchart.com website when you read this report.
Barchart technical indicators:
- 100% technical buy signals
- 31.01+ Weighted Alpha
- 30.70% gain in the last year
- Trend Spotter buy signal
- Above its 20, 50 and 100 day moving averages
- 14 new highs and up 30.70% in the last year
- Relative Strength Index 77.19%
- Technical support level at 42.15
- Recently traded at 42.58 with a 50 day moving average of 39.74
Fundamental factors:
- Assets under management $52.93 million
- P/E 25.54
- Dividend yield .84%
- 345 investors are monitoring the ETF on Seeking Alpha



Comments
Log in or sign up to join the conversation.