

EQUITY SELL-OFF CONTINUES, DOW APPROACHING SUPPORT ZONE
US stocks have continued to sell-off since last week’s FOMC rate decision, and prices in the Dow Jones are now approaching the support zone that we looked at last Friday. During this sell-off, both bearish targets at 24,750 and 24,624 have been met, and the big question now is whether we get a revisit to the support zone that we were previously looking at for potential long scenarios.
Last week’s resistance came-off of the 14.4% Fibonacci retracement of the post-Election move in the index, and prices are now fast approaching the 23.6% marker of that same study.
DOW JONES DAILY CHART: PULLBACK FROM 14.4% FIBONACCI RETRACEMENT CONTINUES
(Click on image to enlarge)
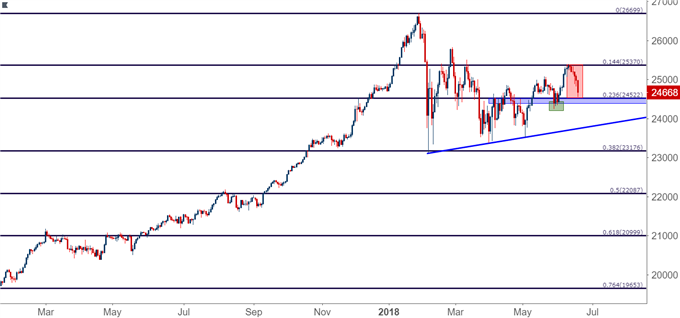
Chart prepared by James Stanley
The support zone that we’ve been following is a confluent area, as that 23.6% retracement from the post-Election move lines up closely with the 50% retracement of the April-June bullish run. That 50% retracement comes in at 24,384, and this is the same area that had helped to produce a swing-low in late-May, just before the Dow ran back-above the 25,000 psychological level. This can keep the door open for topside positions provided that buyers are able to hold support above the swing-low at 24,339.
DOW JONES FOUR-HOUR CHART: FAST APPROACHING KEY SUPPORT ZONE
(Click on image to enlarge)
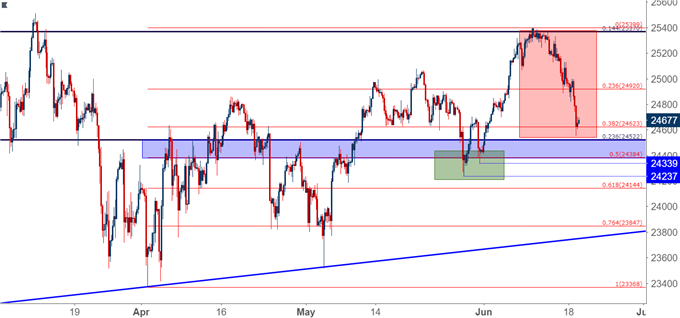
Chart prepared by James Stanley
POTENTIAL FOR DEEPER RISK AVERSION
Given the pace with which this sell-off has started to show, and also considering the drivers that have helped it to develop, and we may have a deeper bearish move in store. The fact that these equity turns began to show around last week’s FOMC and ECB rate decisions do not appear coincidental, and while many are attributing this sell-off to heightened trade tensions, there’s likely something to be said about both acting as some form of bearish catalyst in US stocks. It doesn’t appear as though the Fed is in a spot where they’ll abandon their hawkish drive anytime soon, nor does it appear as though trade tensions are all-of-the-sudden going to become resolved.
This can open the door to bearish breakout potential should prices pierce below the swing-low at 24,237, exposing downside target potential towards 24,144 and 23,847, at which point we’d have a trend-line coming into play taken from the prior February lows.
DOW JONES FOUR-HOUR CHART: DEEPER BEARISH BREAKOUT POTENTIAL
(Click on image to enlarge)
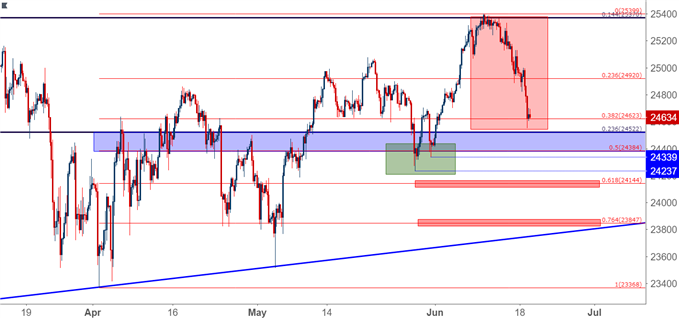
Chart prepared by James Stanley



Comments
Log in or sign up to join the conversation.