


In this technical article we’re going to take a quick look at the Elliott Wave charts of Dollar Index (DXY) published in members area of the website.
As our members know, DXY made a pullback that unfolded as an Elliott Wave Zig Zag pattern. Price completed a clear 3-wave move down from the peak and found support at the Equal Legs zone (buying area). In the following analysis, we explain the Elliott Wave pattern and the market outlook.
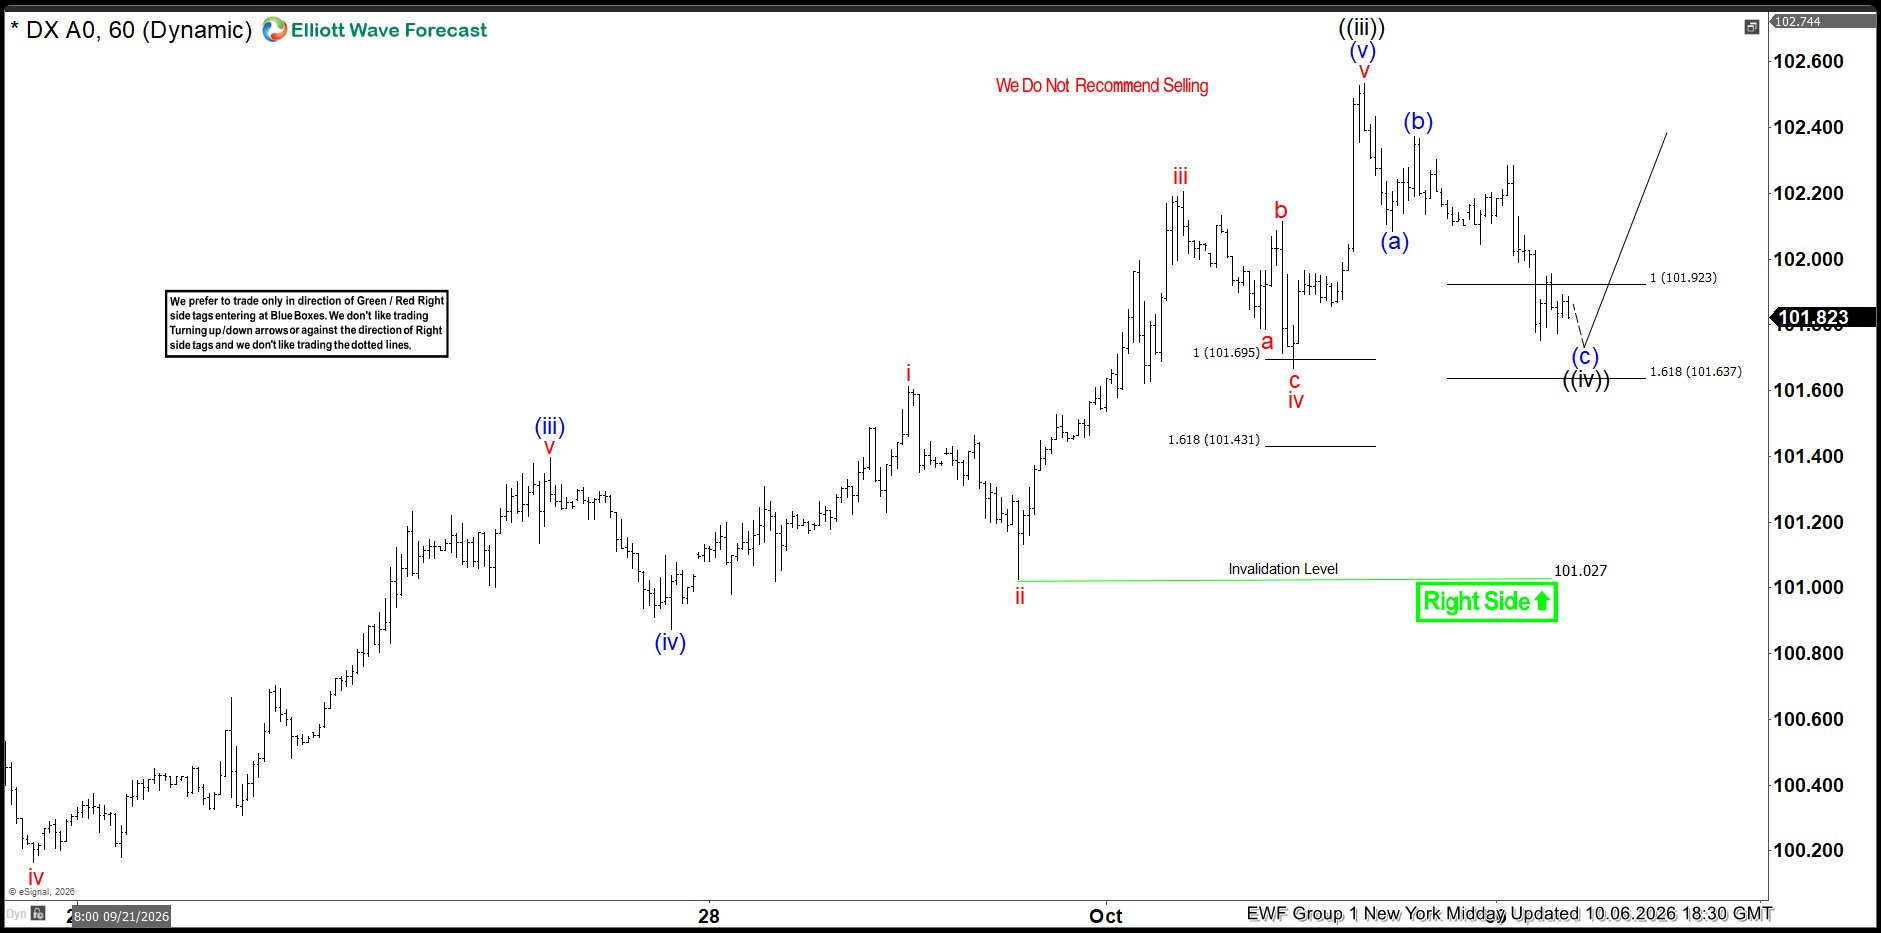
DXY Elliott Wave 1 Hour Chart 10.06.2026
Dollar Index is currently forming an intraday three-wave pullback from the recent highs. We identified a potential buying zone by measuring the Equal Legs area with the Fibonacci Extension tool, projecting the length of wave (a) from the end of wave (b). The ideal support area comes at 101.92–101.63 ( buying zone) . As long as price holds above this region, buyers could step in and support another move higher, with the potential for the Index to resume its rally toward new highs.
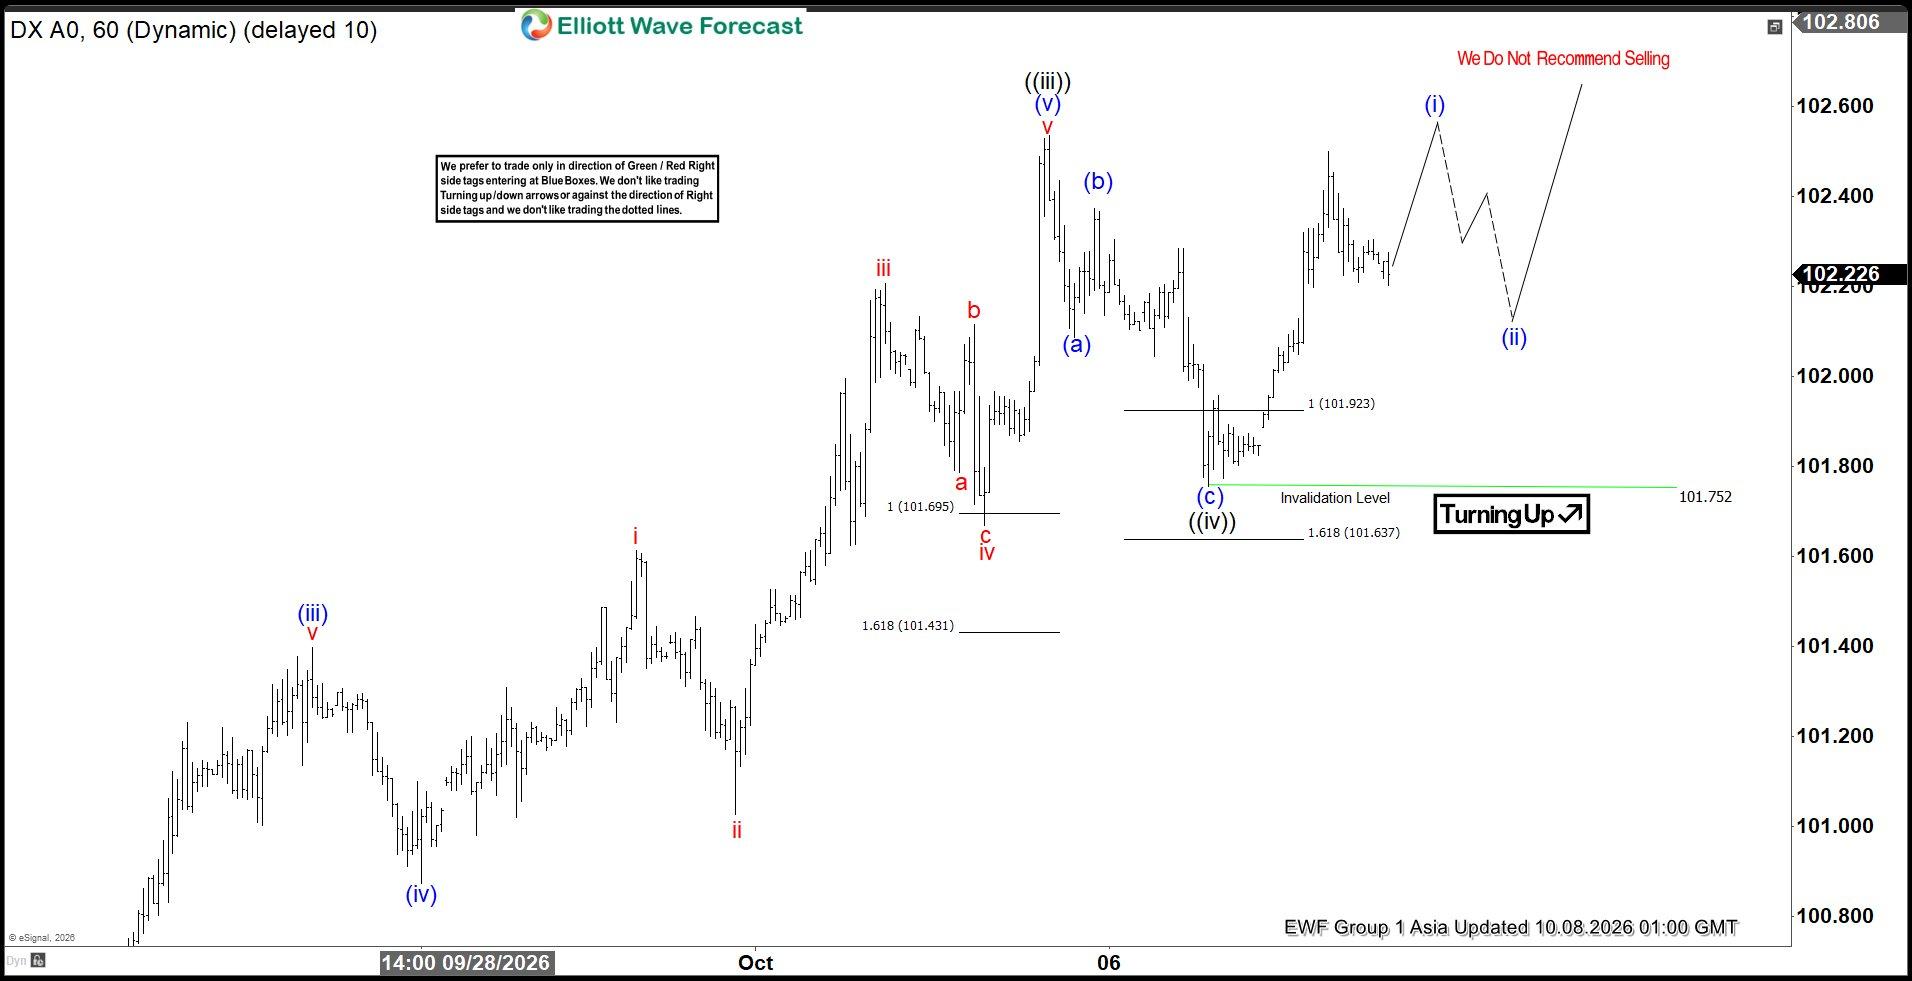
DXY Elliott Wave 1 Hour Chart 10.08.2026
Dollar Index found buyers at the Equal Legs zone, as expected. The correction ended at the 101.75 low, and DXY has since started a rally from that area. The reaction confirms the buying zone was respected, and the bullish sequence is now progressing higher. As a result, long positions taken from the Equal Legs zone can now be considered risk-free after moving the stop to breakeven, while the Index continues to target further upside. As long as the 101.75 pivot holds, Dollar Index can continue higher toward the 102.71–103.01 target area.
Important note: Our analysis is not based on Elliott Wave in isolation. We perform detailed higher-time-frame cycle analysis, which shows an incomplete market structure. This is one of the key drivers of price action, along with correlation analysis and broader market context.
We also teach our members in live analysis sessions how to identify incomplete bullish and bearish sequences. Even a 14-day trial, is enough to noticeably improve your trading analysis and forecasting approach.



Comments
Log in or sign up to join the conversation.