
US DOLLAR TO FRESH 2018 HIGHS, AGAIN
The US Dollar has continued to rally and as we open Tuesday trade out of the US, the currency remains at fresh 2018 highs. We had some commentary from Fed Chair Jerome Powell earlier this morning taken from a speech in Zurich. He had a couple of interesting comments, key of which was remarking that he felt that the role of US monetary policy in driving global capital flows was often exaggerated. He also went on to say that ‘some investors and institutions may not be well positioned for a rise in interest rates, even one that markets broadly anticipate.’ This seemed to imply that there will never be a ‘perfect’ time to hike rates, and this denotes the potential for continued hawkishness at the world’s largest Central bank.
All in all, that speech had a hawkish overtone very similar to what we’ve seen from Mr. Powell so far this year after taking over the reins of the bank in February. This was around the same time that the US Dollar began to carve-out a bottom around 88.42, which is the 61.8% Fibonacci retracement of the 2014-2017 major move. After that support came into play, prices oscillated back-and-forth for a couple of months before buyers eventually took control. And what started as a bear flag/short-squeeze scenario just has not stopped for three weeks, and here we are 5.5% higher in the US Dollar index from those February lows. At this point, we can begin to ask the question of whether or not the US Dollar down-trend has finally come to an end after what was an aggressive fourteen months of selling.
US DOLLAR VIA ‘DXY’ WEEKLY CHART: HAS THE US DOLLAR DOWN-TREND ‘MET ITS MAKER’?
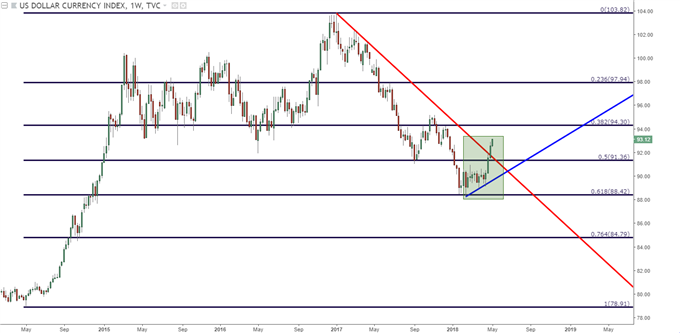
Chart prepared by James Stanley
To get more clarity behind that question, we can focus in on that recent down-trend by adding a Fibonacci retracement. This will help to highlight that while the past few weeks have seen an aggressively-strong US Dollar, we’ve still only retraced a small portion of that prior sell-off. We’ve added that retracement on the below chart in green, and this helps to show how we’ve yet to approach the 38.2% retracement of that prior bearish move. That 38.2% level comes-in very near the 38.2% retracement of the 2014-2017 major move, so this would be a confluent area of potential resistance around 94.30 should the run in USD continue. That area is outlined with a red box on the below chart.
US DOLLAR DAILY CHART: POTENTIAL RESISTANCE APPLIED

Chart prepared by James Stanley
EUR/USD BREAKDOWN CONTINUES
One of the more interesting USD-pairs at the moment is EUR/USD, as sellers remain in-control while pushing prices down to fresh 2018 lows. We looked at a few support levels yesterday, and prices have made a quick move down towards the ‘s1’ level around 1.1853, but bigger picture – where might traders be able to look for longer-term support? After a breach of the vaulted 1.2000 level, bulls have shown little ability to stem the flow of sellers; and this highlights a potential zone that came into play multiple times in the second half of last year. This area runs from 1.1685-1.1736, and this is a confluent area taken from a couple of different longer-term Fibonacci retracements.
EUR/USD WEEKLY CHART: CONFLUENT SUPPORT BELOW
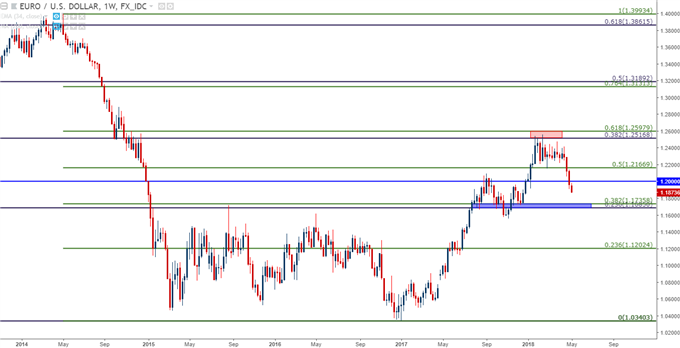
Chart prepared by James Stanley
GBP/USD RUNS INTO 1.3500 SUPPORT – BUT CAN IT HOLD?
While selling in the Euro has been fairly pronounced over the past couple of weeks, the reversal in GBP/USD has been arguably more relevant given the scope of how the move came-in. What started as an aggressively bullish breakout as we came into April posed a stark turn-around along with an even more aggressive bearish reversal that carried through the end of the month. That short-side move has continued into May, and as we move deeper into the second week of the month, GBP/USD is grinding at a level with a bit of historical importance in GBP/USD.
The 1.3500 psychological level helped to hold the low on the pair from the Financial Collapse into the Brexit referendum. Even after Brexit, this level came-up as a quick swing-high before the ‘flash crash’ saw the currency plunge down to 30-year lows. But the relevancy of this level isn’t relegated to antiquated observations, as this area also helped to mark the high in GBP/USD in Q4 of last year, as this level shows right around the 50% retracement of the ‘Brexit move’ in the pair.
GBP/USD WEEKLY CHART: 1.3500 A FAMILIAR LEVEL OF RELEVANCE FOR GBP/USD
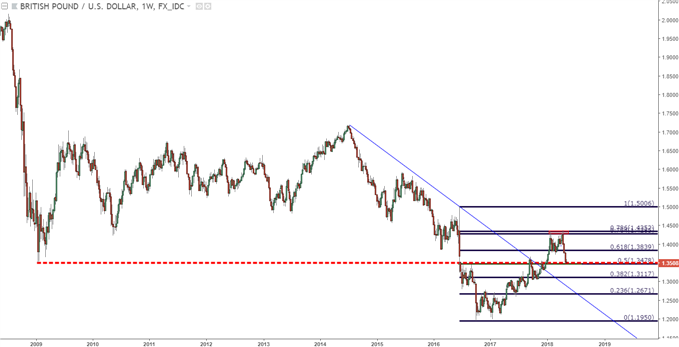
Chart prepared by James Stanley
At this stage, the bearish move in GBP/USD has become oversold on the Daily chart, and prices are back to testing 1.3500 after a quick bounce showed on Friday and led into Monday. With a BoE rate decision on the docket for later this week, the pair is likely to remain volatile as we trade through this week, and this opens the door to the possibility of reversal setups, particularly should this level or area of support continue to hold. We looked at such a setup yesterday in an Analyst Pick, along with a short-side NZD/USD entry order as a hedge designed in the event that USD strength continued in a rather rampant manner.
GBP/USD DAILY CHART: OVERSOLD CABLE GRINDS AT SUPPORT AHEAD OF BOE ‘SUPER THURSDAY’
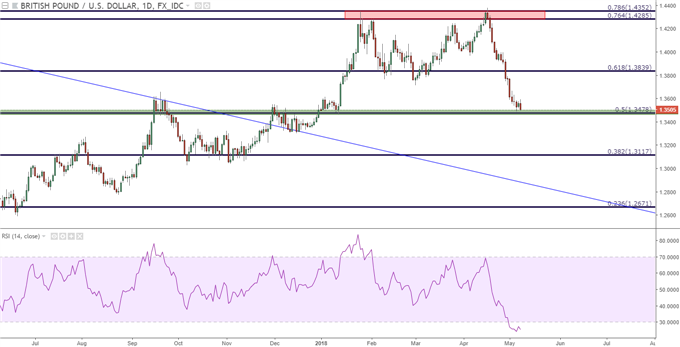
Chart prepared by James Stanley
NZD/USD FOR USD-STRENGTH CONTINUATION
We’ve been following the short-side of NZD/USD for strategies around USD-strength, and we looked at another setup in yesterday’s analyst pick that went along with the GBP/USD setup. The logic was for a short-side breakout entry on print of fresh lows, targeting the support side of a longer-term range that’s been in-play for almost two years now. A break below the big figure of .7000 opens the door for a deeper run towards longer-term range support of .6820-.6870.
NZD/USD WEEKLY CHART: RANGE FILL TARGETS .6820-.6870
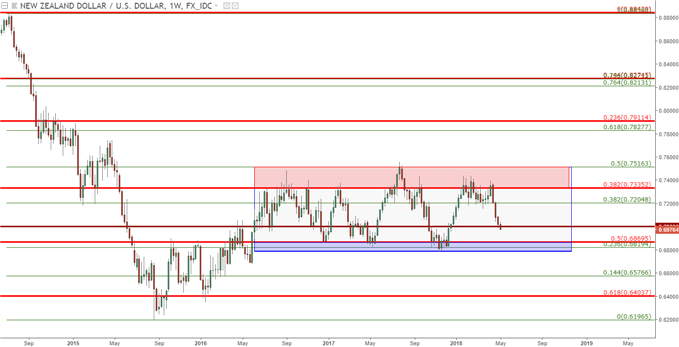
Chart prepared by James Stanley


Comments
Log in or sign up to join the conversation.