

I’ve been wrapping up some long term projects (not planned as long term — they just took longer than expected) on interest rate parity and term spreads, and that spurred me to look at current patterns in interest rates. Some quick observations: interest rates remain higher in emerging markets than in core industrial countries. So too are real rates are higher despite higher inflation rates. And term spreads are larger in the US than other countries.
First, consider nominal interest rates.
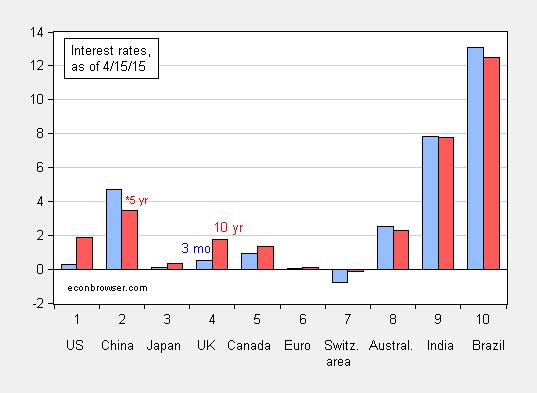
Figure 1: Three month interest rates (blue bar), and ten year interest rates (red bar), as of 4/15/2015. Euro ten year rate is for Germany. Red bar for China is five year interest rate. Source: Economist April 18th edition.
Short rates in the developed countries are low or, as in the case of Switzerland, negative. Short rates in the emerging countries are higher. Uncovered interest rate parity would suggest rough stability for the dollar against the yen, pound and euro. However, as reviewed in work by Chinn and Zhang (2015) and Chinn and Quayyum (2013), the proportion of variation in exchange rate depreciation explained by interest differentials is very small. Even at longer horizons, when interest differentials point in the right direction (at least for developed country currencies), bias has increased in recent years, as interest rates have hit the zero lower bound. Chinn and Zhang provide an explanation, as discussed in this post. For emerging market differentials with the US, it is even more unlikely that interest parity will hold; see Ito and Chinn (2007).
The variation in nominal rates is somewhat compensated for by actual inflation and expected.
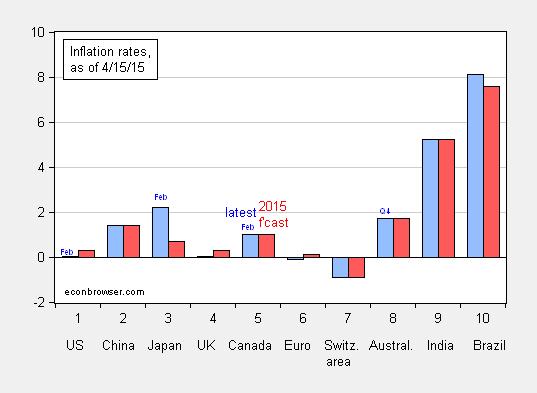
Figure 2: Year on year inflation through March unless otherwise indicated (blue bar), and forecasted inflation rate for 2015 (red bar), as of 4/15/2015. Source: Economist April 18th edition; inflation forecast from Economist Intelligence Unit.
While expected inflation, as measured by the Economist Intelligence Unit survey, is higher in emerging markets (China, Brazil, India) than in the advanced economies, they are typically not sufficiently high to result in low real rates — shown in Figure 3.
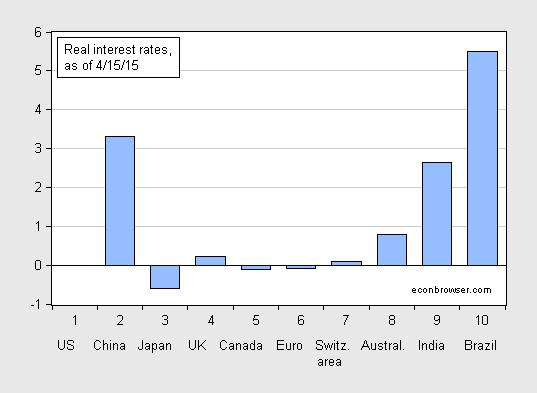
Figure 3: Real interest rates, calculated using three month interest rates and 2015 expected inflation, as of 4/15/2015 (blue bar). Source: Economist April 18th edition, and author’s calculations.
Of course, these are imperfect measures of real rates; the expected inflation horizon and interest maturities do not match. Nonetheless it is interesting that the estimated real rates differ so substantially. Empirical assessments suggest that real interest parity does not hold, so these differences should not be interpreted as deviations that will entirely dissipate over time (see Singh and Banerjee (2006)).
Finally, I thought it of interest to see what term speads look like at the current moment.
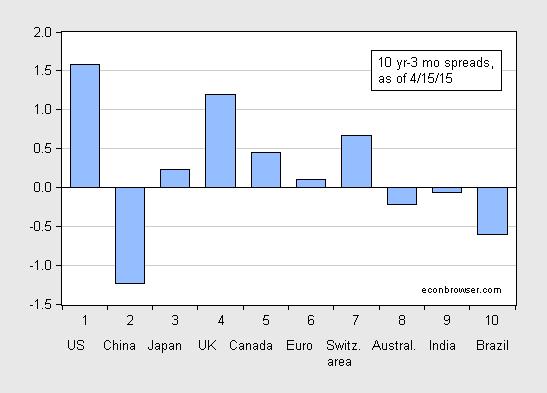
Figure 4: Ten year-three month term spreads, as of 4/15/2015 (blue bar). China observation is Five year-three month term spread. Euro ten year rate is for Germany. Source:Economist April 18th edition, and author’s calculations.
The US spread is the largest displayed. Results in Chinn and Kucko (forthcoming, International Finance) (discussed in this post) sugest continued growth in the US. The UK spread is next largest, but Chinn-Kucko did not find a statistically significant relationship between the spread and IP growth, so no particular conclusion can be drawn. The same can be said for Canada.
For the emerging markets, there is less evidence. Mehl (2006) finds some predictive power in Brazil, but none in India (using five year-three month spreads). Here is one take on the inversion in 2011 in these two countries (WSJ). The Chinese inversion might seem alarming; however, to my knowledge, there is no empirical work documenting a link between the spread and growth in China.



Comments
Log in or sign up to join the conversation.