
--May the Fourth Be With You
 The Walt Disney Company (DIS), together with its subsidiaries and affiliates, is a leading diversified international family entertainment and media enterprise with five business segments: media networks, parks and resorts, studio entertainment, consumer products and interactive media.
May 4th is known among sci-fi cognoscenti as Star Wars Day "May the Fourth Be With You." Fans world-wide use the day to celebrate all things George Lucas and Star Wars. This is a good "holiday" for Disney as well. The studio is finding new-found power in the market place by virtue of its control of the upcoming new Star Wars releases as well as its traditional stronghold with animated children's films such as "Frozen" and "Cinderella." In addition, the studio has content like the massively popular "Avengers" series--which blew out the box office this weekend with sales in excess of $185 million. As today's Wall Street Journal notes, Disney and other studios use their most powerful box office draws to garner more favorable terms from theaters and boost their bottom line.
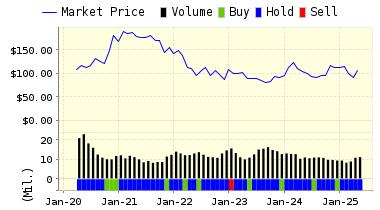
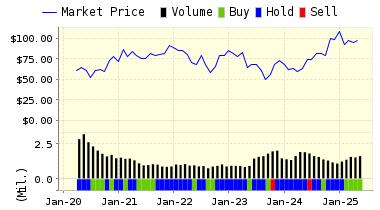
Our models have not been enamored of Disney lately, if you look below you will find that we have had the stock rated a "HOLD" for most of the past two years. However, this may change as analysts update their consensus in light of anticipated blockbusters such as the next Star Wars sequel and other new content. The company reports Q2 2015 results TOMORROW at 8am EST. Those results may also result in some changes for our models.
ValuEngine continues its HOLD recommendation on Walt Disney Company for 2015-05-01. Based on the information we have gathered and our resulting research, we feel that Walt Disney Company has the probability to ROUGHLY MATCH average market performance for the next year. The company exhibits ATTRACTIVE Company Size but UNATTRACTIVE Book Market Ratio.
Below is today's data on DIS :
|
ValuEngine Forecast |
||
|
Target |
Expected |
|
|---|---|---|
|
1-Month |
110.73 | 0.19% |
|
3-Month |
110.38 | -0.12% |
|
6-Month |
110.48 | -0.04% |
|
1-Year |
113.02 | 2.27% |
|
2-Year |
124.80 | 12.92% |
|
3-Year |
81.77 | -26.01% |
|
Valuation & Rankings |
|||
|
Valuation |
9.28% overvalued |
Valuation Rank(?) |
|
|
1-M Forecast Return |
0.19% |
1-M Forecast Return Rank |
|
|
12-M Return |
39.30% |
Momentum Rank(?) |
|
|
Sharpe Ratio |
1.13 |
Sharpe Ratio Rank(?) |
|
|
5-Y Avg Annual Return |
22.00% |
5-Y Avg Annual Rtn Rank |
|
|
Volatility |
19.47% |
Volatility Rank(?) |
|
|
Expected EPS Growth |
15.55% |
EPS Growth Rank(?) |
|
|
Market Cap (billions) |
187.33 |
Size Rank |
|
|
Trailing P/E Ratio |
24.04 |
Trailing P/E Rank(?) |
|
|
Forward P/E Ratio |
20.81 |
Forward P/E Ratio Rank |
|
|
PEG Ratio |
1.55 |
PEG Ratio Rank |
|
|
Price/Sales |
3.75 |
Price/Sales Rank(?) |
|
|
Market/Book |
14.90 |
Market/Book Rank(?) |
|
|
Beta |
1.17 |
Beta Rank |
|
|
Alpha |
0.15 |
Alpha Rank |
VALUATION WATCH: Overvalued stocks now make up 59.86% of our stocks assigned a valuation and 22.46% of those equities are calculated to be overvalued by 20% or more. Fifteen sectors are calculated to be overvalued--with six at or near double digits.


Comments
Log in or sign up to join the conversation.