

As the S&P 500 struggles to rise a fraction of a percentage point to be able to achieve the status of reclaiming its February all-time high level…
Imagine you could go back to February 19, 2020. The SPY has just closed at a new all-time high, and news of the COVID-19 virus causing havoc in China is in the headlines, but this time you know that a pandemic will soon cripple the U.S. economy and crash the stock market from its peak to down over 30% faster than any other time in history.
You also know the market will recover quicker than anyone expects led by technology companies that will find a silver lining in the chaos and provide the same for their shareholders.
Knowing that sliver of the future, you’re asked: Which ETF will make you the best return from then (February 19th) to now, the time when the SPY returns to its February levels?
You must choose between XRT or QQQ.
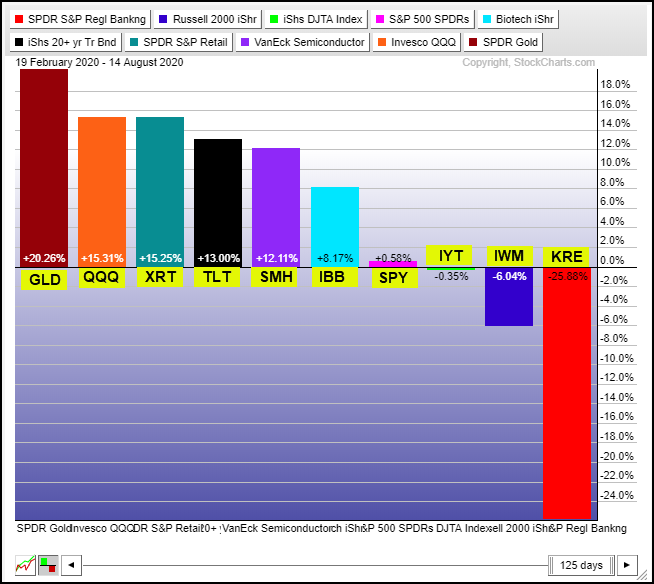
First, I have to give a big “thank you” to Stock Charts, which made it so easy for me to provide you with these charts. Note, I added the tickers to the chart’s bars to make it quicker to read.
As you can see from the charts below, Grandma Retail (XRT) has some real fight in her. I’d call it a tie.
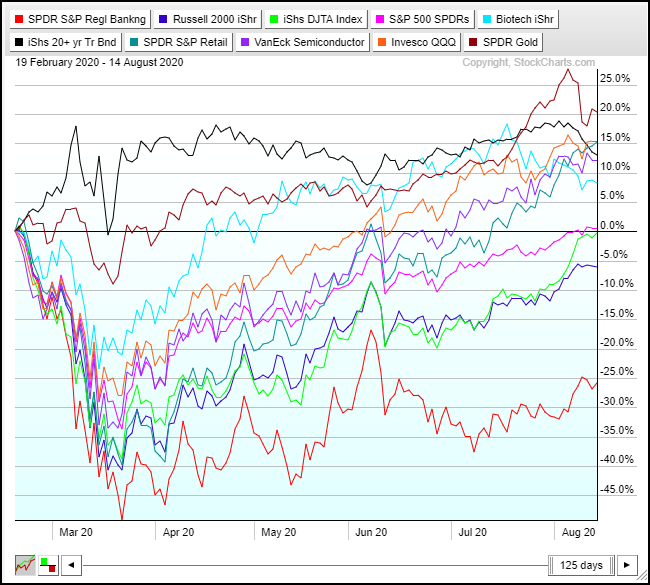
Here’s a different view of the same group of symbols over the same time frame so you can see their journey.
Now let’s do the same exercise, but starting from the March 23rd low in the SPY.
The low was created by the Fed’s announcement that it will do whatever it takes to stabilize the bond markets, including buying corporate bonds at every grade (all way down to Junk!).
From the chart above, you already know XRT has kept up with the QQQ, and crushed the SPY since February.
And you know that since February the banks (KRE) have been the worst performer.
That said…Which ETF will do better from the lows, bonds (TLT) or the banks (KRE)?
The answer is below. I’ll leave the analysis and the “why?” up to you, so as not to cloud this simple message, which is also the theme of this week’s Market Outlook. If you want to follow the market, sometimes you need to remember not to let what logic get in the way of reality.
As traders, we have several ways of saying this. For example…trade what you see, not what you think.
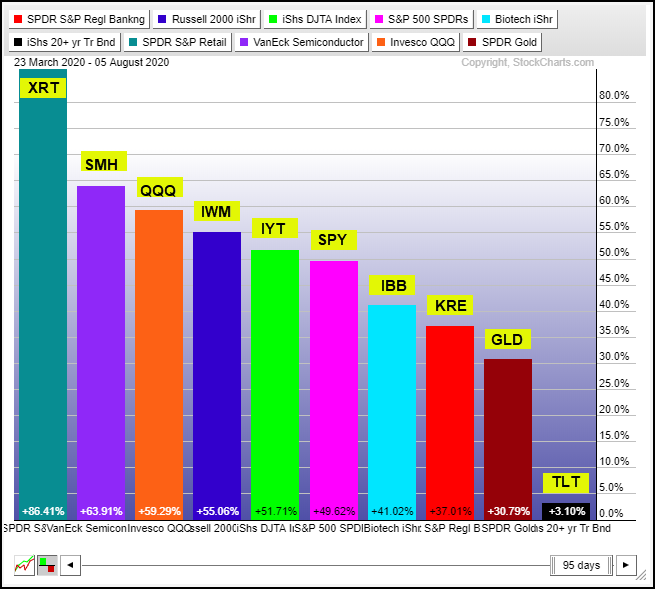
Here’s a look at how the same group of symbols from above have moved since the SPY low. Note the color of the lines and bars are not the same in these charts as the ones above.
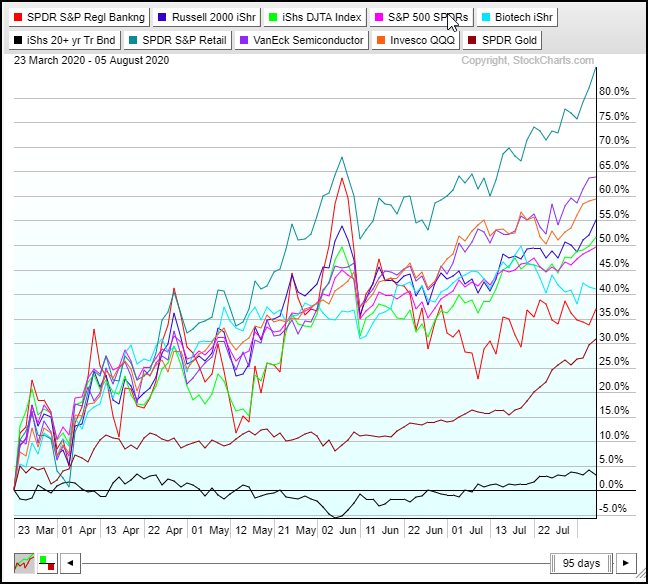
Here’s the same data with an easier way to see the end result.
If you’d like to make your own charts like these, here’s a link to this list of symbols in the StockCharts’ default view and time frame (200 days). You can change the time frame by clicking on the slider’s number of days at the bottom right and the chart type with the icons at the bottom left.



Comments
Log in or sign up to join the conversation.