


Nvidia, Inc. (NVDA) produced impressive fiscal Q2 revenue and earnings, but its free cash flow (FCF) and FCF margins were lower than in Q1. NVDA may be stuck in a trading range, despite analysts' higher price targets. As a result, shorting out-of-the-money (OTM) puts might be the best play here.
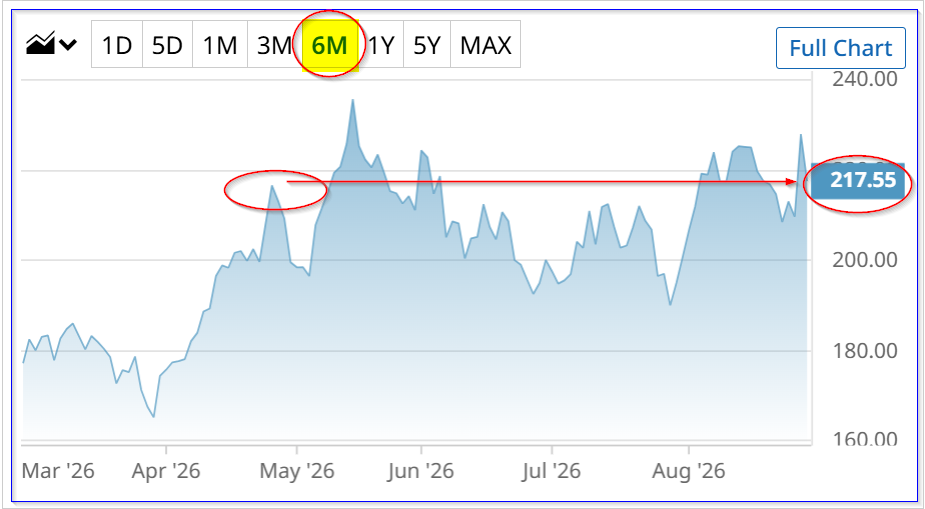
NVDA fell on Friday, Aug. 28, to $217.55. That's only slightly higher than before it released its results on Aug. 26 ($213.05 on Aug. 25).
Moreover, NVDA stock has essentially been flat for the past 4 months since the end of April (i.e., NVDA was at $216.61 on April 27). That can be seen in the Barchart chart below.
I discussed shorting NVDA cash-secured puts a week ago in the Aug. 23 Barchart article, “Nvidia Stock Is Treading Water Ahead of Earnings This Week - What's the Best NVDA Play?”
At the time, NVDA was at $214.72. I showed that investors could earn $4.48 shorting the $200.00 strike put expiring Sept. 25. That works out to a 2.24% one-month yield.
As of Friday, Aug. 28, the put premium had fallen to just $1.98, so over half the income yield has been made already, even though NVDA stock is only up slightly.
So, now, it makes sense to roll this play over. First, let's look at Nvidia's updated valuation after its latest earnings and cash flow results.
Free Cash Flow Disappoints
Despite generating much higher Q2 revenue than the market and analysts expected (i.e., $96.2 billion vs. $92.07 billion forecasted, as I pointed out in my Barchart article), free cash flow (FCF) came in lower than expected.
FCF in Q2 was $21.34 billion, much lower than the $48.554 billion last quarter, although that was much higher than the $13.45 billion FCF last year.
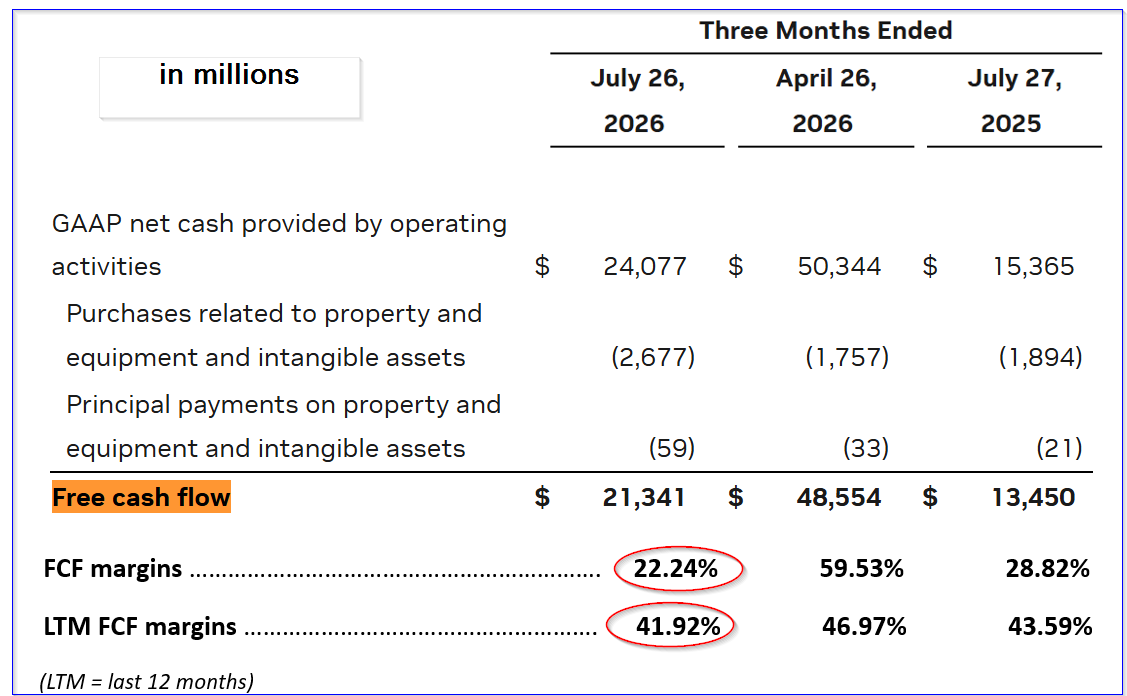
Nvidia Q2 FCF and FCF margins (from Stock Analysis data)
Moreover, the FCF margin was much lower, as the table above shows (the FCF margins, i.e., FCF/ revenue, were taken from Stock Analysis data). For example, the Q2 FCF came in at 22.2%, lower than 59.5% in Q1 and 28.8%, according to Stock Analysis.
And over the past year, FCF represented almost 42% of revenue, down from 47% in Q1 and 43.6% in Q2 last year (over the prior 12 months).
Maybe FCF margins will decline as revenue increases. But it does affect the valuation.
Forecasting Nvidia's FCF
Analysts now project revenue will be $665.4 billion next year (year ending Jan. 2028), or 62% higher than the $410.86 billion expected this year.
Moreover, Nvidia's CEO, Jensen Huang, told Fox Business in an interview after the earnings on Aug. 26 that all of its chip capacity and revenue had been presold through next year. He told Fox that “demand is accelerating.”
Just to be conservative, let's use the midpoint of these two revenue forecasts (i.e., the next 12 months or NTM forecast) and apply a 42% FCF margin:
$538 billion NTM revenue x 0.42 = $226 billion FCF
That's about $100 billion higher than the $127 billion in FCF over the last 12 months (LTM), according to Stock Analysis.
In other words, Nvidia could be worth much more over the next year.
NVDA Price Targets
For example, assuming the market valued NVFDA with a 3.3% FCF yield metric, it could be worth $6.8 trillion, or 30% higher:
$226b / 0.033 = $6,848 billion fair market value (FMV)
Yahoo! Finance says Nvidia's market cap on Friday was $5.253 trillion (i.e., $5,253 billion). So, a FCF-yield-based price target (PT) is 30% over this:
$6,848b / $5,253b = 1.30
In other words, NVDA stock is now worth 30% more, or over 282 per share:
1.30 x $217.55 price = $282.82 PT
Wall Street analysts have even higher price targets. Yahoo! Finance says the average of 61 analysts is $305.79, and Barchart's mean survey PT is $321.59.
The bottom line is NVDA looks significantly undervalued here.
But what if NVDA stays flat, like over the past four months? Or maybe its trading range moves higher, but essentially stays level with some ups and downs.
Shorting NVDA Puts
In that case, the best play is to repeatedly short cash-secured out-of-the-money (OTM) puts. For example, look at the Oct. 9 expiry period.
The $205 put strike price has a midpoint premium of $4.50. That means a short-seller earns a 40-day 2.2% yield (i.e., $4.50/$205.00 = 0.02195 = 2.195%).
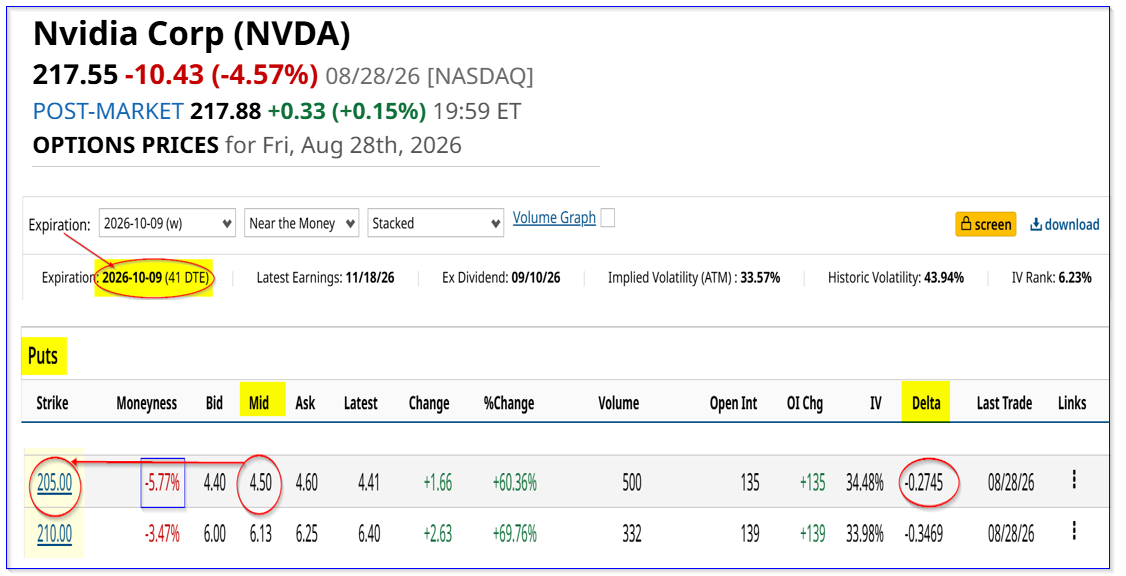
NVDA puts expiring Oct. 9 - Barchart - As of Aug. 28
In other words, after posting $20,500 with a brokerage firm as collateral, the investor's account immediately receives $450.
As long as NVDA stays over $205, or 5.8% below Friday's close, the account will not be assigned to acquire 100 shares at $205 (i.e., the $20.5K collateral).
This way, an investor can potentially buy NVDA at a lower point: ($205 - $4.50 = $200.50). That's 7.8% below Friday's close. That would occur if NVDA drops to $205 anytime in the next 40 days.
Conclusion
NVDA stock may be stuck in a trading range, as it has for the past four months, although its value is at least 30% higher. Maybe this trading range will shift higher.
Either way, investors can take advantage of high put option premiums by shorting out-of-the-money NVDA puts. That way, they earn income while waiting to buy in at a lower price.
For example, the expected return (ER) assuming the 2.195% short-put yield over 41 days can be repeated for four months (120 days) is 6.585%. And, over one year, it's almost 20% (19.76%).
That's two-thirds of the price target expected return. It assumes these short-term yields can be repeated each month. The investor may be able to buy in at a lower price.
The bottom line is this is an alternate way for investors to make money with NVDA stock.


Comments
Log in or sign up to join the conversation.