


Dell Technologies (DELL) maintains a bullish long-term Elliott Wave outlook following its strong rally toward $600. The weekly chart suggests that the stock is progressing within a larger impulsive structure, with a potential corrective pullback ahead before the next advance. As long as the broader bullish pattern remains intact, DELL could continue higher.
The weekly chart shows that Dell completed a major corrective phase in wave II before starting a new bullish cycle. From that low, the stock developed an impulsive advance through multiple waves, followed by a strong breakout that accelerated the uptrend. DELL has now reached wave ((3)) of the larger bullish sequence. After this substantial advance, the preferred Elliott Wave outlook anticipates a corrective wave ((4)). The projected path suggests that this pullback could unfold through several swings before buyers regain control and the broader uptrend resumes.
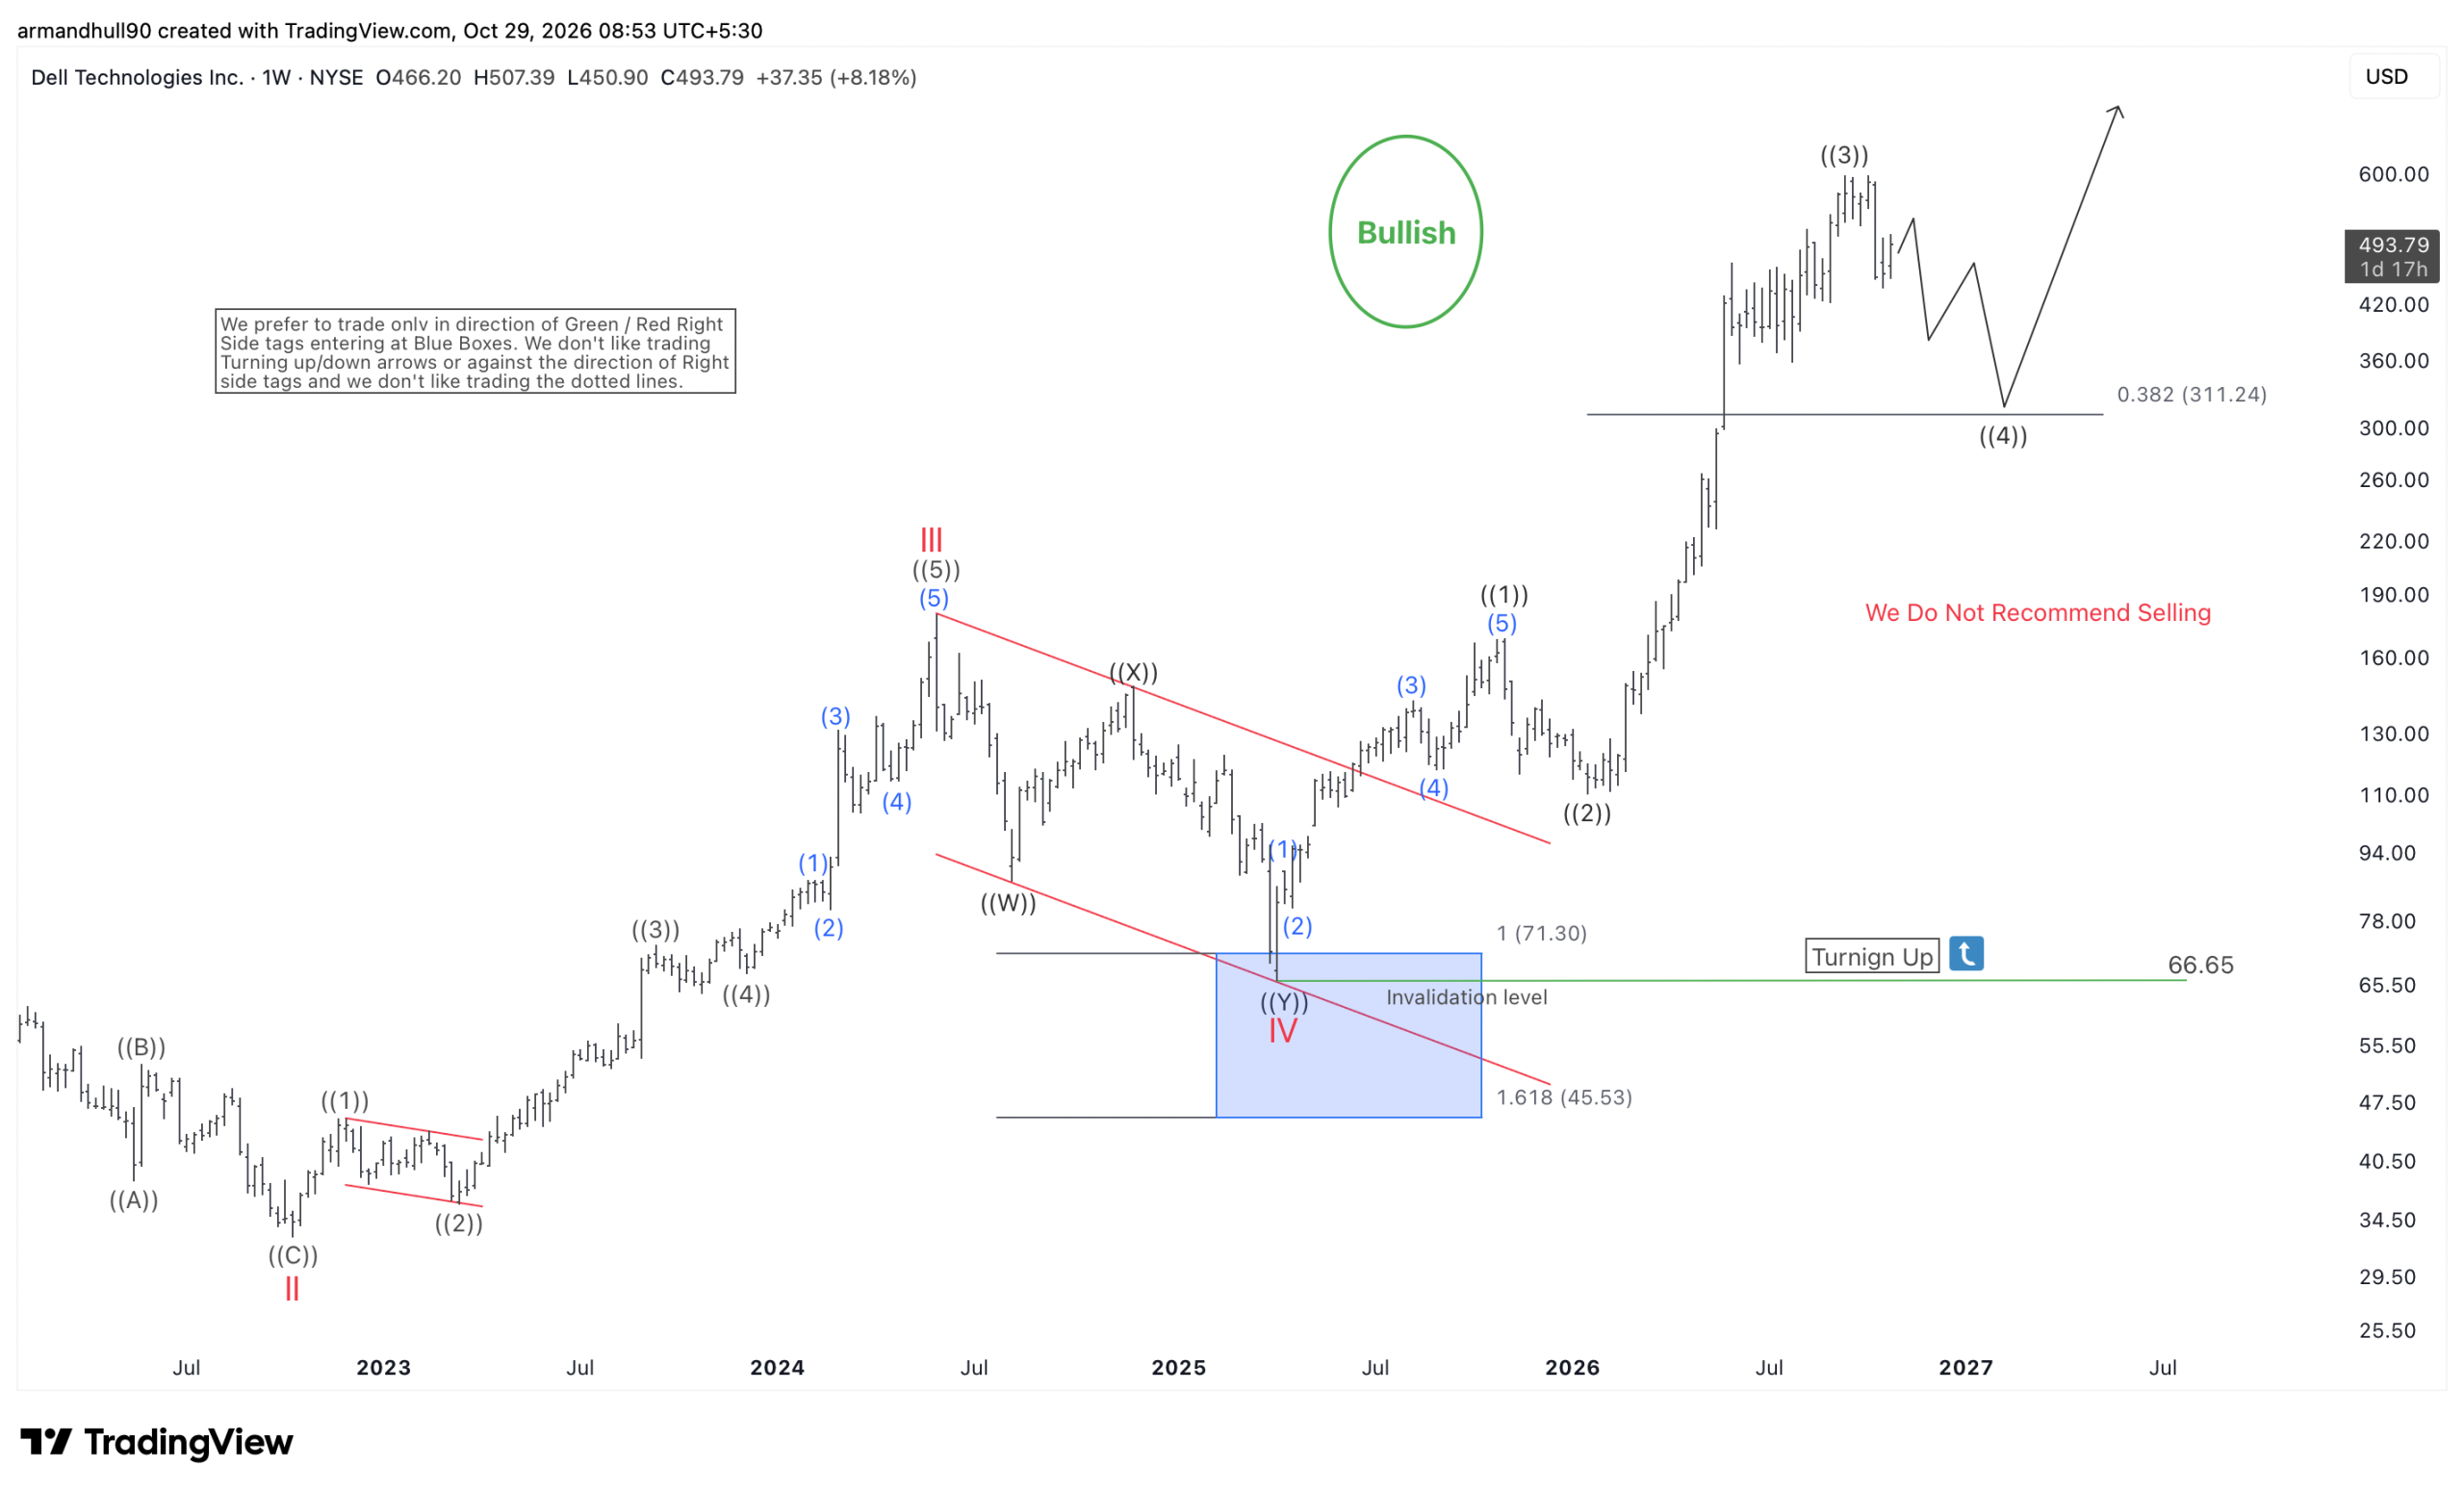
DELL Stock Forecast: Key Support at $311.24
The chart identifies $311.24 as the 38.2% Fibonacci retracement level and a potential support area for wave ((4)). The stock could experience a multi-swing correction toward this region before beginning another impulsive advance. The earlier blue box buying area between approximately $45.53 and $71.30 marked a potential turning point. Dell subsequently rallied significantly, supporting the bullish interpretation that emerged from this setup.
The chart also marks $66.65 as the structural invalidation level for the earlier bullish setup. This is a long-term technical reference, not a practical short-term stop-loss.
What’s Next for Dell Stock?
Once wave ((4)) completes, it could resume its advance in wave ((5)), potentially challenging $600 and moving toward higher levels. This outlook depends on the corrective structure completing as anticipated. Overall, our Dell Technologies Elliott Wave forecast remains bullish. Investors should monitor the $311.24 support region for signs of a corrective low before expecting another rally. Although volatility may continue, the broader chart favors further upside rather than selling against the prevailing trend.



Comments
Log in or sign up to join the conversation.