
Previously Digest Issue 51 "Omicron Strikes Again [Charts]" painted a bleak picture after equities turned lower once again on depressing Covid Omicron news. However, after only one day the mood suddenly changed when the bulls and "buy the dippers" got busy again. Like a light switch, Omicron turned the markets neurotic along with help from a few other concerns like inflation and expected interest rate hikes. This week a short Market Review focuses on the S&P 500 Index.
S&P 500 Index (SPX) 4766.18 added 40.39 points or +.85% last week after an important break out above 4700 last Monday since a failure at this level would have increased concern of a triple top that began in early November. For the year it gained 1010.11 points or 26.89% (4766.18 -3756.07). Now trading in new high territory be aware of the next pullback because that's what it does after making new highs. Some are very small and hardly noticeable, others more significant.
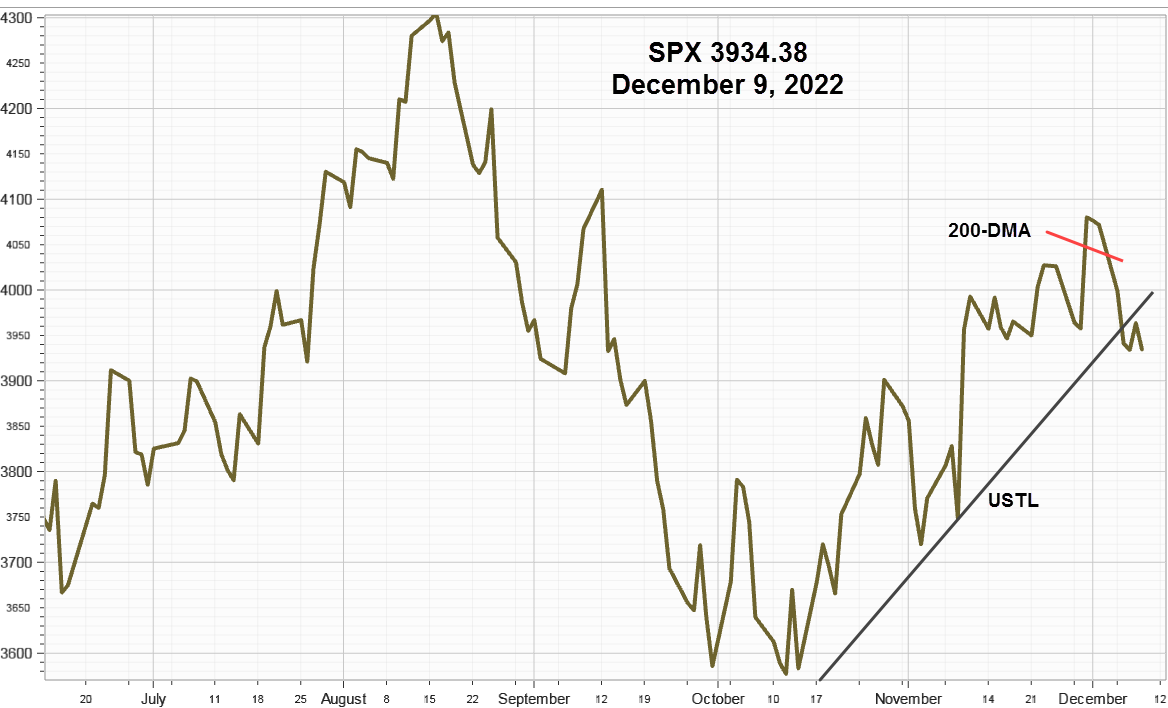
With the usual disclaimer that past performance does not guarantee future results, the last two important pullbacks, the early October Head & Shoulders bottom and the double bottom in early December, breached the 50-day Moving Average then ended on the operative upward sloping trendline, USTL that began on October 30, 2020, shown in the chart below.

In the event this pullback pattern repeats, it will first close below the 50-day Moving Average, now 4656.99 (not shown in the chart) then reverse on or near the USTL. However, prior to the last October pullback the 50-day Moving Average held many times. Should both the 50-day Moving Average and the USTL fail to hold the decline, then it will be time to start hedging long positions as the medium-term upward sloping trendline will be in jeopardy.
CBOE Volatility Index® (VIX) declined .74 points or -4.12% last week ending at 17.22 consistent with SPX making new highs. Our similar IVolatility Implied Volatility Index Mean, IVXM using four at-the-money options for each expiration period along with our proprietary technique that includes the delta and vega of each option, declined .83 points or -6.19% to end at 12.59%. The one-year chart below shows the high on January 27, at 29.05% with the low on June 25, at 10.32%.

VIX Futures Premium
VIX futures premium ended Friday at 20.46% in the bullish green zone vs. 25.42% on December 23 with January the new front month contract that expires on January 19. It's now well into bullish territory as SPX makes new closing and intraday highs. This compares to a premium of 2.52% on Friday December 17, when the front month contract only had two trading days before expiration and rapidly losing time value and markets were concerned that Omicron could cancel the traditional Santa Claus rally. Then by December 23, the premium increased quickly to 25.42% as the VIX declined after turn around Tuesday December 21, when SPX advanced 81.21 points or +1.78%.

The chart reflects the distance from the VIX to the futures curve computed from the two front month contracts. Since most of the volume and open interest are in the two closest futures contracts measuring the volume-weighted premium relative to the standard 30-day VIX provides a good real-time sentiment indicator based upon actual commitments of large Asset Managers and Leveraged Funds.
Market Breadth as measured by our preferred gauge, the NYSE ratio adjusted Summation Index that considers the number of issues traded, and reported by McClellan Financial Publications. Finally, after a long decline, last week it advanced 228.38 points ending at -101.36. For the week ending December 23, it declined 1.53 points after reaching a low of -384.97 on December 21. Then it turned up on December 22 gaining 19 points after SPX advanced 81.21 points on the day before. Failure to turn thereby higher creating a divergence would have been troubling. Improving breadth confirms the market advance and should delight the bulls presuming it continues improving. While not quite a stampede, at least the herd turned in the right direction.

Strategy
In the last two weeks rotation out of stocks with high price-to-earnings (P/E) multiples and those without earnings valued on price-to-sales basis continued. Further weakness in the tech sector will likely be attributed to more rotation out of high P/E growth stocks into consumer staples and dividend payers with shorter duration as the market adjusts to higher interest rates expected this year.
The new SPX highs renewed the medium-term upward sloping trendline shown in the chart above producing a good objective way to measure the severity of the next pullbacks that are sure to continue until shutdown fear due to Covid Omicron diminish. First, watch the 50-day Moving Average and then the trendline. Consider hedges should the trendline fail to support the next decline.
Summary
Until December 21, it seemed the anticipated annual Santa Claus rally would not arrive. That changed as the S&P 500 Index as it gained 81.21 points or 1.78%, then continued higher breaking out above resistance from previous highs on December 27 adding another 52.72 points or 1.12%. Volatility and market breadth indicators confirmed the changed market sentiment, although volume was less than usual for the last two weeks. For now, the bulls have it.
Comments
Log in or sign up to join the conversation.