

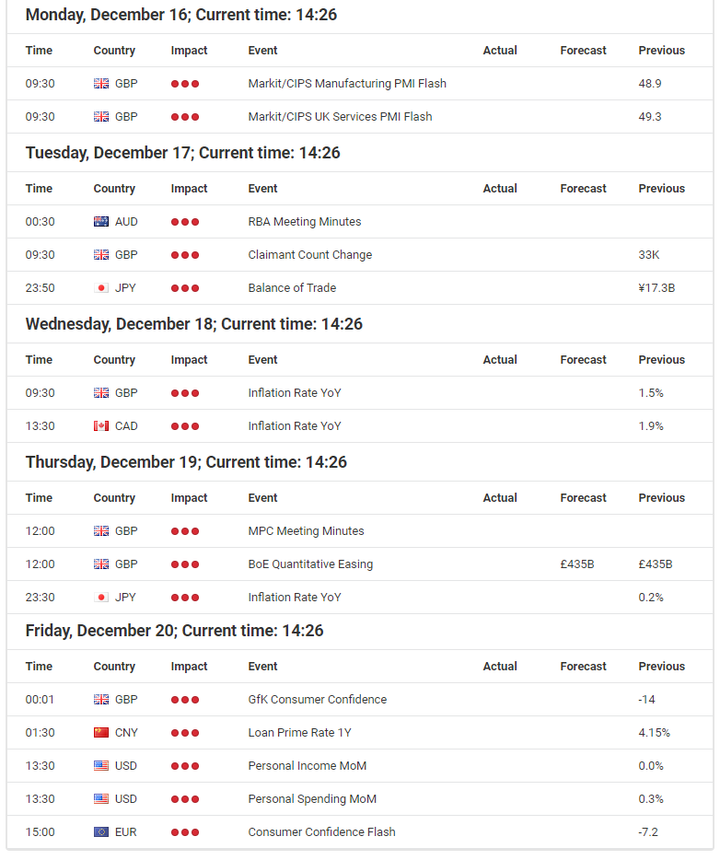
Source: Economic Events Calendar December 16 – 20, 2019 - Admiral Markets' Forex Calendar
DAX30 CFD
The DAX30 CFD saw a very volatile week with new yearly highs, even though despite the Fed and ECB rate decisions no impulses were delivered.
The Fed, as expected, didn't deliver a rate cut and came across as 'balanced' in its statement, meaning that while the Fed dot plot signalled no interest-rate changes in 2020, the Fed Watch Tool remained at an expectation of around 50% for at least one 25 basis point cut in 2020.
The main driver for the bullish action was certainly the "deal" between the US and China where both sides are said to have agreed on a reduction on existing tariffs and a delay of those being planned to go into effect on December 15.
In addition to this, there was a landslide victory of UK prime minister Johnson's Tories in the General election, making it possible for a near-term Brexit deal while diminishing uncertainty among market participants. The Fed announced that it will flood markets with $500 Billion in liquidity to avoid a year-end repo crisis (and will thus extend the Fed balance sheet to new record highs by mid-January), which all resulted in cheering bulls in the German index.
That said, our take is DAX30 CFD bullish into the yearly-close, seeing a high likelihood of new all-time highs and a push to and above 13,600 points in the days to come:
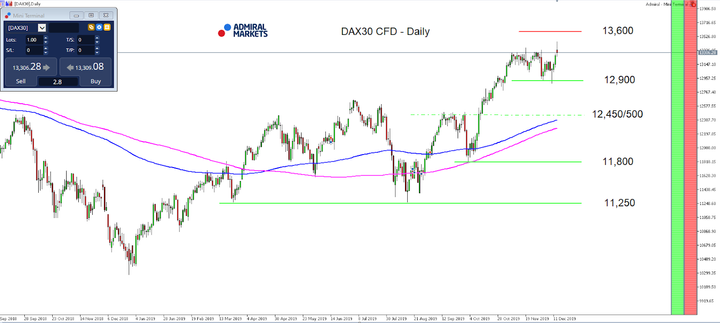
Source: Admiral Markets MT5 with MT5-SE Add-on DAX30 CFD Daily chart (between September 5, 2018, to December 13, 2019). Accessed: December 13, 2019, at 10:00pm GMT - Please note: Past performance is not a reliable indicator of future results, or future performance.
In 2014, the value of the DAX30 CFD increased by 2.65%, in 2015, it increased by 9.56%, in 2016, it increased by 6.87%, in 2017, it increased by 12.51%, in 2018, it fell by 18.26%, meaning that after five years, it was up by 10.5%.
Check out Admiral Markets' most competitive conditions on the DAX30 CFD and Dow Jones CFDs and start trading on the DAX30 CFD with a low 0.8 point spread offering during the main Xetra trading hours!
US Dollar
Over the last week, the outlook for the US dollar hasn't significantly changed, despite the Fed rate decision. It was likely restrained by ongoing USD scepticism.
The Fed, as expected, didn't deliver a rate cut and came across as 'balanced' in its statement, meaning that while the Fed dot plot signalled no interest-rate changes in 2020, the Fed Watch Tool remained at an expectation of around 50% for at least one 25 basis point cut in 2020.
While 10-year USD yields saw a spike higher on the latest US-Chinese trade-talk developments, as both sides agreed on a reduction on existing tariffs and a delay of those being planned to go into effect on December 15, as well as the Fed announcement to flood markets with $500 Billion in liquidity to avoid a year-end repo crisis (and will thus extend the Fed balance sheet to new record highs by mid-January), pushed the US dollar lower.
In addition to our scepticism in regards to the US economy, a continuation of the drop lower in 10-year US Treasury yields remains relatively high and thus should result in further bearish momentum in the US dollar.
Nevertheless, from a technical perspective the sequence of higher highs and lows stays intact as long as the USD Index Future stays above 95.00 points on a weekly time frame:
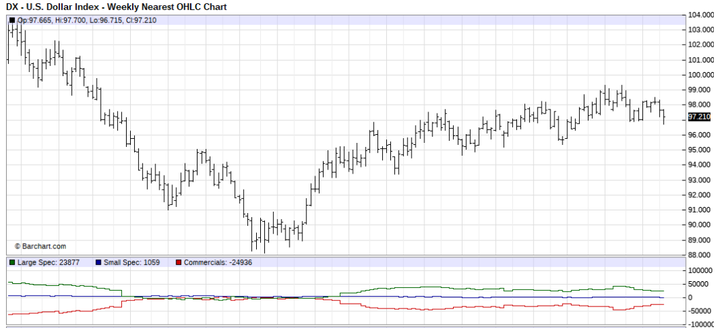
Source: Barchart - U.S Dollar Index - Weekly Nearest OHLC Chart (between May 2016 to December 2019). Accessed: 13 December 2019 at 10:00 PM GMT
Don't forget to register for the weekly "Trading Spotlight" webinar with presenters including Jens Klatt, every Monday, Wednesday and Friday at 2pm London time! It's your opportunity to follow Jens and others as they explore the weekly market outlook in detail, so don't miss out!
Euro
The first ECB rate decision with president Christine Lagarde hasn't been spectacular at all.
While Lagarde is a known dove, and thus favours a more dovish monetary policy approach, her first press conference can be interpreted as unspectacular and fairly neutral, probably with a slight tendency to appease the dissatisfied hawks and unite the lately fragmented ECB board again after the announcement of QE-ternity in September, explaining the solid Euro performance into the second half of the week.
In addition to our sceptical outlook for the US dollar (please find details in the US dollar paragraph above) and the landslide victory of UK prime minister Johnson's Tories in the UK General election, making a near-term Brexit deal and diminishing uncertainties among market participants here likely, our expectation of continuing speculations around fiscal stimulus and additional public investment (especially from Germany), the EUR/USD could see a significant push higher with the Euro finding a first target around 1.1280/1300, while a breakthrough levels the path up to 1.1400 in the weeks to come and as long as we trade above 1.1000:
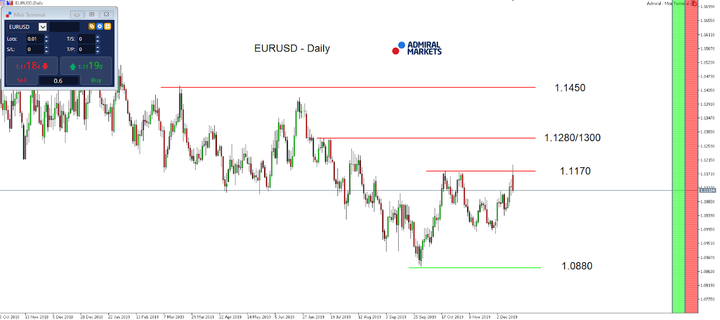
Source: Admiral Markets MT5 with MT5-SE Add-on EUR/USD Daily chart (between October 22, 2018, to December 13, 2019). Accessed: December 13, 2019, at 10:00pm GMT - Please note: Past performance is not a reliable indicator of future results, or future performance.
In 2014, the value of the EUR/USD fell by 11.9%, in 2015, it fell by 10.2%, in 2016 it fell by 3.2%, in 2017 it increased by 13.92%, 2018 it fell by 4.4%, meaning that after five years, it was down by 16.5%.
JPY
After the announcement of a "deal" between the US and China and markets being "hit" by a risk-on-tendency, the USD/JPY pushed back above 109 in the last weekly close – but we remain cautious in regards to the sustainability.
The primary reason for our scepticism is the Fed: the Fed, as expected, didn't deliver a rate cut and came across as 'balanced' in its statement, meaning that while the Fed dot plot signalled no interest-rate changes in 2020, the Fed Watch Tool remained at an expectation of around 50% for at least one 25 basis point cut in 2020.
This dovish expectation of market participants is not surprising at all when looking at the Fed announcing that she will flood markets with $500 Billion in liquidity to avoid a year-end repo crisis (and will thus extend the Fed balance sheet to new record highs by mid-January) last Thursday.
With the Fed's balance sheet currently expanding at a faster rate than during QE1, QE2 or QE3 and (in our opinion) a very fragile "deal" between the US and China (a delay of tariffs of those being planned to go into effect on December 15 only shows that trade talks are not going well at all…), we still consider USD/JPY a potential short candidate.
This expectation is also underlined by the latest comments from the BoJ which stated that it expects a sizable impact from the economic package from prime minister Shinzo Abe and that the BoJ could as a result its GDP forecast in January.
Nevertheless, into the yearly close and with the current risk-on-mode making the JPY an attractive short-candidate as a funding currency for Carry trades, we remain cautious in regards to an overly bearish USD/JPY outlook.
But USD/JPY stays, from a risk-reward perspective midterm, an attractive Short candidate, with the main focus being on 106.80/107.00, where from a technical perspective a break lower could result in a drop as low as 105.00 and probably even lower:
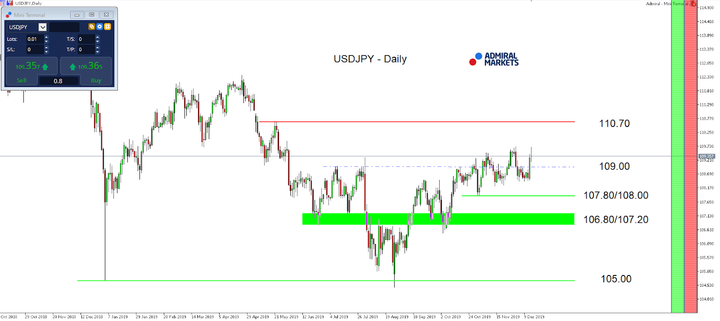
Source: Admiral Markets MT5 with MT5-SE Add-on USD/JPY Daily chart (between October 5, 2018, to December 13, 2019). Accessed: December 13, 2019, at 10:00pm GMT
In 2014, the value of the USD/JPY increased by 13.7%, in 2015, it increased by 0.5%, in 2016, it fell by 2.8%, in 2017, it fell by 3.6%, in 2018, it fell by 2.7%, meaning that after five years, it was up by 4.1%.
Gold
After the announcement of a "deal" between the US and China and markets being "hit" by a risk-on-tendency, Gold still presented itself stable and solid into the weekly close – a deeper look shows why this is not such a big surprise.
The main reason is the Fed: the Fed, as expected, didn't deliver a rate cut and came across as 'balanced' in its statement, meaning that while the Fed dot plot signalled no interest-rate changes in 2020, the Fed Watch Tool remained at an expectation of around 50% for at least one 25 basis point cut in 2020.
This dovish expectation of market participants is not surprising at all when looking at the Fed announcing that she will flood markets with $500 Billion in liquidity to avoid a year-end repo crisis (and will thus extend the Fed balance sheet to new record highs by mid-January) last Thursday.
With the Fed's balance sheet currently expanding at a faster rate than during QE1, QE2 or QE3 and (in our opinion) a very fragile "deal" between the US and China (a delay of tariffs of those being planned to go into effect on December 15 only shows that trade talks are not going well at all…) and chances of another, near-term drop in 10-year-US-Treasuries yields elevated, Gold stays an attractive Long-candidate.
That's also true with the opening of a seasonal bullish window in Gold between December 18 and January 10, where Gold saw an average gain of 47 USD for 12 of the past 15 years, while in the remaining three years, it dropped on average only 19.65 USD, while the maximum loss and the maximum drawdown being 31.03 USD.
With that in mind, technically our picture switches to Long again with Gold breaking back above 1,520 USD which would level the path up to the current yearly highs around 1,557 USD:
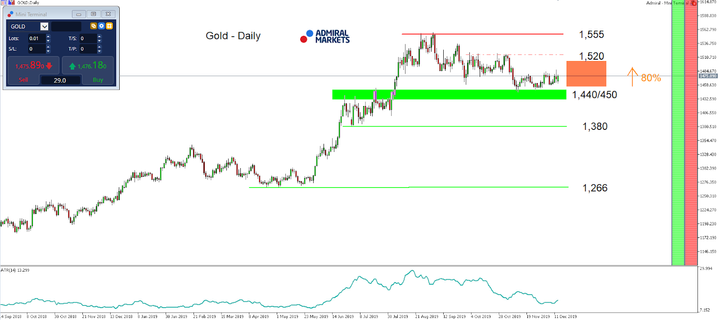
Source: Admiral Markets MT5 with MT5-SE Add-on Gold Daily chart (between September 14, 2018, to December 13, 2019). Accessed: December 13, 2019, at 10:00pm GMT - Please note: Past performance is not a reliable indicator of future results, or future performance.
In 2014, the value of Gold fell by 1.7%, in 2015, it fell by 10.4%, in 2016, it increased by 8.1%, in 2017, it increased by 13.1%, in 2018, it fell by 1.6%, meaning that after five years, it was up by 6.4%.



Comments
Log in or sign up to join the conversation.