

DAX30 CFD
After the prolonged Easter weekend, the German DAX30 started the last week of trading solidly, but got hit hard later in the week as bears regained control of the price action.
As we pointed out in our last weekly market outlook, it was quite difficult to spot the real driver behind the move higher in Equities which was close to 30% from its March lows.
Probably it was a combination of the clear expectation among market participants that we "have to" see another test of the March lows and the hope that global central banks, especially the Fed, will not just pump massive liquidity into the system, but also bring everything back to "normal", no matter what.
But as we also mentioned, such high hopes are probably too optimistic and while the panic mode avoided another aggressive leg lower, the now returning optimism comes a little too early and is a little too much, potentially resulting in another sentiment extreme (only at the other side of the spectrum) and thus a sharper push lower in the DAX30 becomes now a serious option.
Short-term and technically we stay positive (even though with a neutral touch) as long as the German index holds above 10,100/150 points.
A drop below that level again leaves room for an accelerating drop which targets the region around 9,300 respectively 9,150/200 points in the days to come:
(Click on image to enlarge)
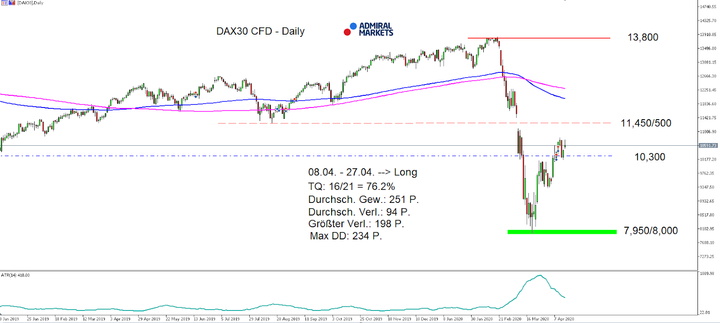
Source: Admiral Markets MT5 with MT5-SE Add-on DAX30 CFD Daily chart (between January 3, 2019, to April 17, 2020). Accessed: April 17, 2020, at 10:00pm GMT - Please note: Past performance is not a reliable indicator of future results, or future performance.
In 2015, the value of the DAX30 CFD increased by 9.56%, in 2016, it increased by 6.87%, in 2017, it increased by 12.51%, in 2018, it fell by 18.26%, in 2019, it increased by 26.44% meaning that after five years, it was up by 34.2%.
Check out Admiral Markets' most competitive conditions on the DAX30 CFD and start trading on the DAX30 CFD with a low 0.8 point spread offering during the main Xetra trading hours!
US Dollar
While we remain very sceptical in regard to the outlook for the US dollar, the USD Index Future held above the 99.00 points over the last week of trading.
That seems surprising when looking at it from different angles: first of all there is the US central bank Fed which has pumped its balance sheet to over 6.0 trillion USD in around 1 month and further "pumping" to follow after the announcement to take additional actions and provide up to $2.3 trillion in loans to support the economy, adding to her already massive Treasury buying program now also elements from the high-yield universe.
While this may seem especially relevant from a mid- to long-term perspective, last week's Retail Sales data coming in at -8.7% and thus at an All Time Low 'topping' its former All Time Low at -3.9% in 2008 during the Great Financial Crisis and knowing about the importance of Retail Sales for the US economy (many consider Retail Sales the backbone of the US economy), in addition to the explosion in initial jobless claims, does not paint a prosperous picture for the US dollar in the short-term, either.
Main reason for the solid USD Index Future performance is most likely the very weak performance of the Euro which leaves the Greenback, despite the dark fundamental picture with further upside potential, making another stint higher with target around 105.00 points an option.
(Click on image to enlarge)
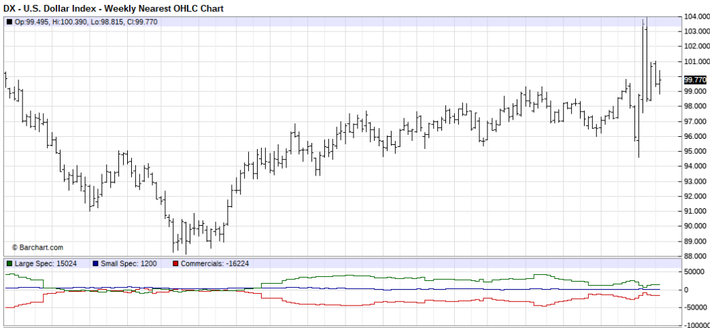
Source: Barchart - U.S Dollar Index - Weekly Nearest OHLC Chart (between January 2017 to April 2020). Accessed: April 17, 2020, at 10:00 PM GMT
Don't forget to register for the weekly "Trading Spotlight" webinar with presenters including Jens Klatt, every Monday, Wednesday and Friday at 2pm London time! It's your opportunity to follow Jens and others as they explore the weekly market outlook in detail, so don't miss out!
Euro
The mode in the Euro and here especially in EURUSD stays choppy.
Still, the failed attempt to recapture 1.1000 and the aggressive drop in the Euro on Wednesday and into the second half of the week leaves us with an overall bearish outlook and it seems likely that we get to see a rather sooner than later re-test of the March lows around 1.0630.
While the agreement from EU Finance ministers before the Easter weekend to a common emergency plan to limit the economic impact of the coronavirus pandemic on the EU, with members having agreed to an emergency response plan of €500 billion, it seems small compared the massive stimulus from the Fed and the US government.
Especially with the Fed having ballooned its balance sheet now to over 6 trillion USD within weeks and the Euro not really profiting from a weak US dollar is not what we would usually expect.
That said, the drop in the Euro is probably the start of another aggressive wave lower with a break below 1.0600/30 making a further drop in the EURUSD as low as 1.0500 and probably even lower a serious option:
(Click on image to enlarge)
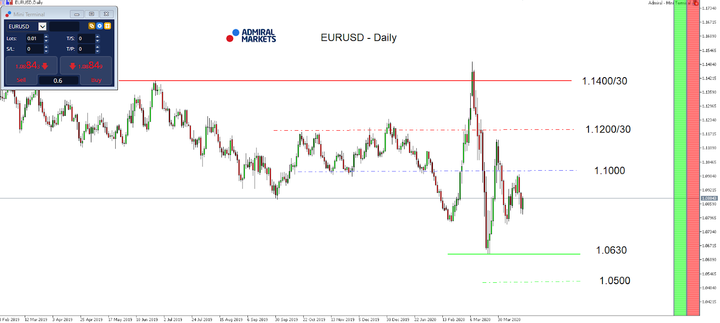
Source: Admiral Markets MT5 with MT5-SE Add-on EUR/USD Daily chart (between February 18, 2019, to April 17, 2020). Accessed: April 17, 2020, at 10:00pm GMT - Please note: Past performance is not a reliable indicator of future results, or future performance.
In 2015, the value of the EUR/USD fell by 10.2%, in 2016, it fell by 3.2%, in 2017, it increased by 13.92%, 2018, it fell by 4.4%, 2019, it fell by 2.2%, meaning that after five years, it was down by 7.3%.
JPY
In our last weekly market outlook we wrote for USDJPY
[…]Technically the currency pair made back some of its recent losses after its drop back below 108.50/109.00, with the overall mode staying choppy, but in our opinion an overall bearish touch.[…]
Our main point for this bearishness has been the expected pressure on 10-year-US Treasury yields which indeed continued and thus left USDJPY testing the short-term relevant region of support around 107.00.
A sustainable break wasn't seen yet, but if we get to see one in the days to come, a test of the region around 105.00 and even a push lower seems a realistic option.
Still, we'd like , to point out that a next wave of risk-off could result out of an again increasing demand for the US dollar given the global USD shortage where the usage of the re-installed swap lines of the Fed from the BoJ could result in an ongoing squeeze higher.
Still, this potential might have diminished over the last days respectively weeks with the massive monetary stimulus from the Fed which has pumped their balance sheet over the last weeks by nearly 2 trillion USD and resulted in a dropping LIBOR-OIS-spread.
So, while we certainly need to wait if such a wave of risk off really hits the markets and will really result in a strong USD demand, a test, probably even break of the region around 112.00/30 would be an option.
(Click on image to enlarge)
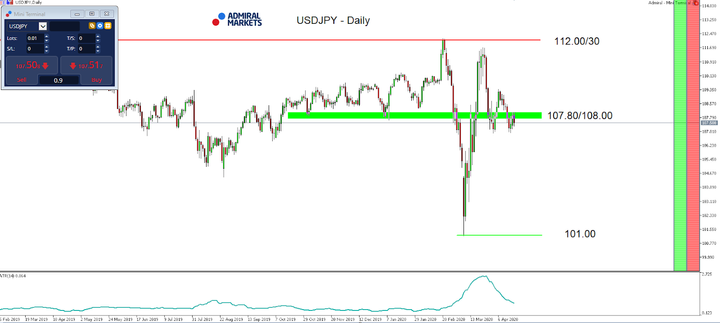
Source: Admiral Markets MT5 with MT5SE Add-on USD/JPY Daily chart (between February 25, 2019, to April 17, 2020). Accessed: April 17, 2020, at 10:00pm GMT
In 2015, the value of USD/JPY increased by 0.5%, in 2016, it fell by 2.8%, in 2017, it fell by 3.6%, in 2018, it fell by 2.7%, in 2019, it fell by 0.85%, meaning that after five years, it was down by 9.2%.
Gold
While Gold marked new yearly highs over the last week of trading and pushed above 1,700 USD for the first time since 2012, the overall picture in Gold compared to our last weekly market outlook hasn't substantially changed.
Looking at Gold from a pure technical perspective leaves us with a clear bullish picture as long as we trade above 1,440/450 USD.
Although, we can see first signs of a potential bearish divergence in the RSI(14) on the daily time-frame pointing to some diminishing bullish momentum and leaves the break to new highs with a grain of salt, increasing the likelihood of a near-term correction with a potential first target around 1,650 USD.
Fundamentally, short-term a next wave of de-leveraging hitting global financial markets stays an option in our opinion, mainly driven by the given global USD shortage, resulting also in a next wave of aggressive selling in Gold due to liquidity reasons.
Mid- to long-term Gold stays bullish, especially given the massive monetary stimulus from the Fed over the last weeks with pumping its balance sheet to over six trillion USD:
(Click on image to enlarge)
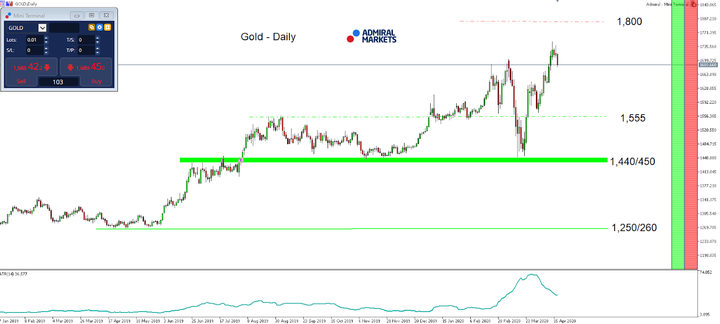
Source: Admiral Markets MT5 with MT5-SE Add-on Gold Daily chart (between January 17, 2019, to April 17, 2020). Accessed: April 17, 2020, at 10:00pm GMT - Please note: Past performance is not a reliable indicator of future results, or future performance.
In 2015, the value of Gold fell by 10.4%, in 2016, it increased by 8.1%, in 2017, it increased by 13.1%, in 2018, it fell by 1.6%, in 2019, it increased by 18.9%, meaning that after five years, it was up by 28%.



Comments
Log in or sign up to join the conversation.