
DAX30 CFD
In our last weekly market outlook we noted
[…]But, again: speculations around Remdesivir being a potential and effective Coronavirus treatment are not new and we'd like to emphasize that one should potentially be careful in being too hopeful and optimistic.[…]
Since these speculations did not grow over the last days, the drop back below 11,000 points in the German DAX30 did not come as such a big surprise.
Still, what was surprising, is that after the German Constitutional Court ruled last Tuesday that some ECB actions in regards to asset purchases respectively the QE are unconstitutional and thus not valid in Germany since the ECB decisions are not backed by the EU treaty, the German index consolidated, but did not break substantially lower.
Such a move could have been certainly expected since the ruling covers the PSPP program, NOT the PEPP program to dampen the negative economic impact of the Corona lockdown and which goes even a step further and buying also Greek bonds, not taking the rating of the issuing EU country into account.
While we are not sure if we really should consider that as a bullish sign, it is for sure not a bearish one.
That said, we are still careful in terms of DAX30 CFD long engagements, even though short-term and technically we stay positive as long as the German index trades above 10,300 points and a push back above 11,000 points over the next days stays an option:
(Click on image to enlarge)
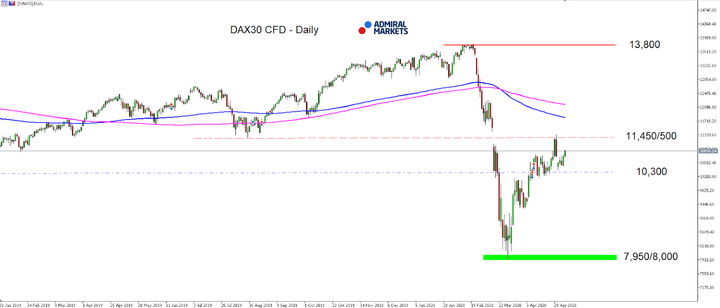
Source: Admiral Markets MT5 with MT5-SE Add-on DAX30 CFD Daily chart (between January 23, 2019, to May 8, 2020). Accessed: May 8, 2020, at 10:00pm GMT - Please note: Past performance is not a reliable indicator of future results, or future performance.
In 2015, the value of the DAX30 CFD increased by 9.56%, in 2016, it increased by 6.87%, in 2017, it increased by 12.51%, in 2018, it fell by 18.26%, in 2019, it increased by 26.44% meaning that after five years, it was up by 34.2%.
US Dollar
When looking at the USD Index Future, the picture hasn't significantly changed over the last week of trading. In fact, the USD Index Future kept on stabilising around 100.00 points, despite horrific US economic data from the US labor market with ADP employment change coming in at -20.2 million, wiping out nearly one decade of created jobs in the private sector due to the Corona lockdown in the US alone.
The explanation can be clearly found in the Euro weakness, especially after the ruling of the German Constitutional Court last week of Tuesday (for details, please check the paragraph below).
This in mind keeps us very sceptical in terms of US dollar long engagements, since we expect further monetary and fiscal stimulus from the US government and the Fed, weighing fundamentally on the USD outlook.
But given the current developments especially in the Euro, but also in Emerging markets with capital fleeing these markets and liquidity pouring back into the USD, we still see potential on the upside, making another stint higher with a target around 105.00 points an option.
(Click on image to enlarge)
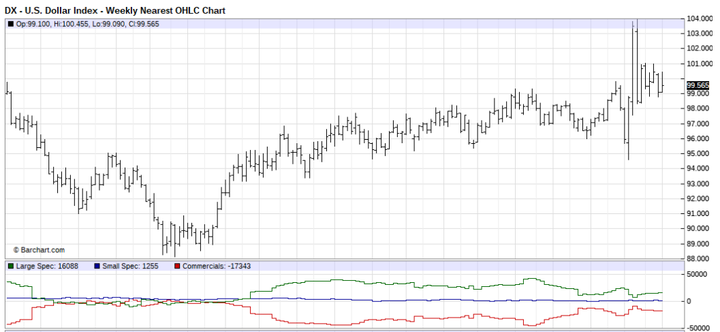
Source: Barchart - U.S Dollar Index - Weekly Nearest OHLC Chart (between January 2017 to May 2020). Accessed: May 8, 2020, at 10:00pm GMT
Euro
Our bearish outlook sharpened over the last week of trading: the German Constitutional Court ruled on Tuesday that some ECB action in regards to Asset purchases respectively the QE is unconstitutional and thus not valid in Germany since the ECB decisions are not backed by the EU treaty.
The court gave the ECB now a 3-month ultimatum to "fix" its QE program. It didn't take long with the ECB responding, saying that it has taken note of German Constitutional Court ruling and remains fully committed to its inflation mandate.
What's noteworthy here is that this ruling covers the PSPP program, NOT the PEPP program which goes even a step further and also buying Greek bonds, not taking the rating of the issuing EU country into account.
As a result, the Euro took on bearish momentum again, bringing the focus back on the current yearly lows around 1.0630 and making even a significant drop lower highly likely, reason: we already pointed out in our last weekly market outlook that by not raising the size of the ECB emergency bond buying package (PEPP), but keeping it at 750 billion Euro, we received a "not so positive sign" already, since the European economy is highly dependent on a massive monetary and fiscal stimulus program to recover from the Corona-lockdown.
With the ruling of the German Constitutional Court, chances of a significant raise of PEPP became probably even unlikelier, leaving the Euro vulnerable to further losses, even against the also weak US dollar.
Technically, only recapturing 1.1000 would brighten the picture a little:
(Click on image to enlarge)
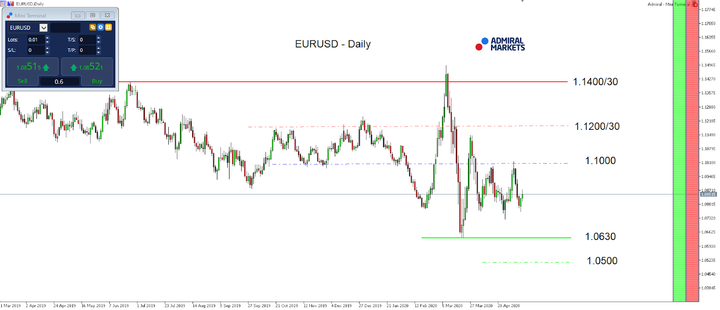
Source: Admiral Markets MT5 with MT5-SE Add-on EUR/USD Daily chart (between March 11, 2019, to May 8, 2020). Accessed: May 8, 2020, at 10:00pm GMT - Please note: Past performance is not a reliable indicator of future results, or future performance.
In 2015, the value of the EUR/USD fell by 10.2%, in 2016, it fell by 3.2%, in 2017, it increased by 13.92%, 2018, it fell by 4.4%, 2019, it fell by 2.2%, meaning that after five years, it was down by 7.3%.
JPY
The performance of the USD/JPY has not been very spectacular over the last days, even though we stay with our overall bearish outlook on the USD/JPY currency pair.
That is probably especially true after last week's US economic data sets from the labour market which came in at "catastrophic" levels with the ADP seeing a print at -20.2 million and the NFP's on Friday seeing a print at -20.5 million.
And even though we didn't see much in terms of volatility, since these data sets could be expected at such low levels, especially after initial jobless claims showing a number of over 30 million over the course of the last seven weeks, it underlines one aspect from our last weekly outlook: here we pointed to the last Fed statement and the willingness of the Fed to take further monetary action in a worsening economic situation.
And since the economic outlook keeps on worsening in the US and given the ongoing massive monetary and again and again emphasized fiscal stimulus from the US government to fight the economic impact of the Corona lockdown, a test of the region around 105.00 and even a push lower seems a realistic option in the days and weeks to come in the USD/JPY:
(Click on image to enlarge)
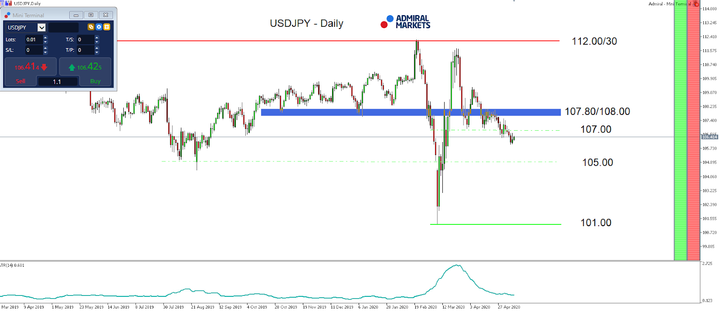
Source: Admiral Markets MT5 with MT5-SE Add-on USD/JPY Daily chart (between March 18, 2019, to May 8, 2020). Accessed: May 8, 2020, at 10:00pm GMT
In 2015, the value of the USD/JPY increased by 0.5%, in 2016, it fell by 2.8%, in 2017, it fell by 3.6%, in 2018, it fell by 2.7%, in 2019, it fell by 0.85%, meaning that after five years, it was down by 9.2%.
Gold
Even though US economic data sets from the labour market came in at "catastrophic" levels with the ADP seeing a print at -20.2 million and the NFP's on Friday seeing a print at -20.5 million, Gold presented itself all in all quite stable and the overall picture didn't significantly change.
Main reason for the all in all unspectacular performance in the yellow metal despite these bad data sets is most likely that these could be expected at these levels, especially after initial jobless claims showing a number of over 30 million over the course of the last seven weeks.
Given the massive monetary and fiscal stimulus from the US government and the Fed to fight the economic impact of the Corona lockdown, a next sharper leg up remains a serious option, and brings the region around 1,750 USD back into focus in the days to come.
Still, the bearish divergence in the RSI(14) on a daily time-frame (orange) is still a topic and would be confirmed with a break below 1,660 USD, making a deeper corrective move as low as 1,630/35 USD possible.
(Click on image to enlarge)
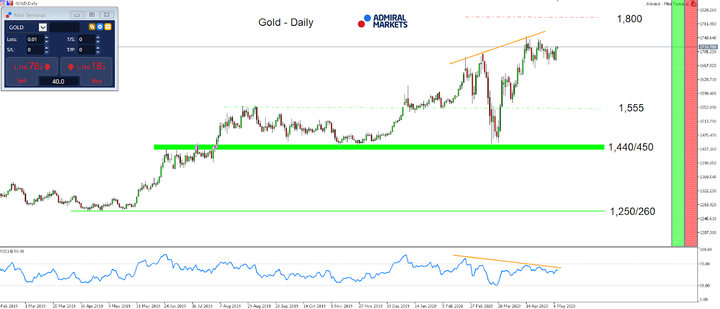
Source: Admiral Markets MT5 with MT5-SE Add-on Gold Daily chart (between January 31, 2019, to May 8, 2020). Accessed: May 8, 2020, at 10:00pm GMT - Please note: Past performance is not a reliable indicator of future results, or future performance.
In 2015, the value of Gold fell by 10.4%, in 2016, it increased by 8.1%, in 2017, it increased by 13.1%, in 2018, it fell by 1.6%, in 2019, it increased by 18.9%, meaning that after five years, it was up by 28%.


Comments
Log in or sign up to join the conversation.