
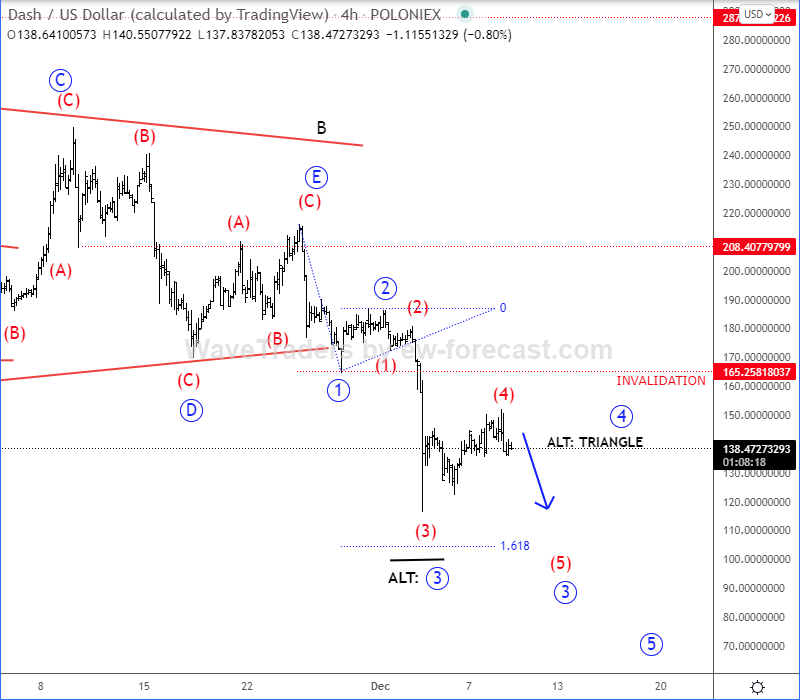
DSHUSD remains nicely bearish as expected after we noticed a completed bearish triangle in wave B on a daily chart. Well, now that is accelerating even lower, seems like a higher degree wave C is in progress, which should be completed by a five-wave bearish cycle. So, be aware of more weakness in the 4-hour chart, ideally towards June lows and 90-60 support zone before bulls show up again, but after the current pullback in wave 4 that can also form a triangle pattern. The invalidation level remains at 165.
Dash 4h Elliott Wave Analysis
(Click on image to enlarge)
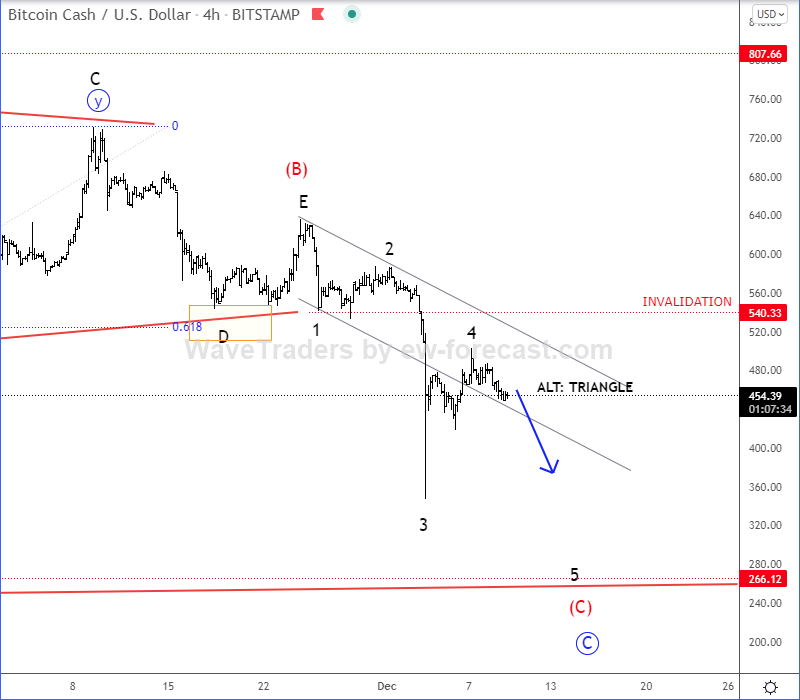
BCHUSD is coming even lower in the 4-hour chart after we mentioned and highlighted a completed bearish triangle in wave (B). So, with the current sharp and impulsive break below July lows, seems like a wave (C) is already in progress with room down to 300-200 support areas that can be reached within a five-wave cycle. Current recovery still looks to be wave 4 correction, which can be already completed or still in progress as a bearish triangle formation, however, in both cases be aware of a continuation lower for wave 5 of (C), while the price is below 540 invalidation level.
Bitcoin Cash 4h Elliott Wave Analysis
(Click on image to enlarge)


Comments
Log in or sign up to join the conversation.