
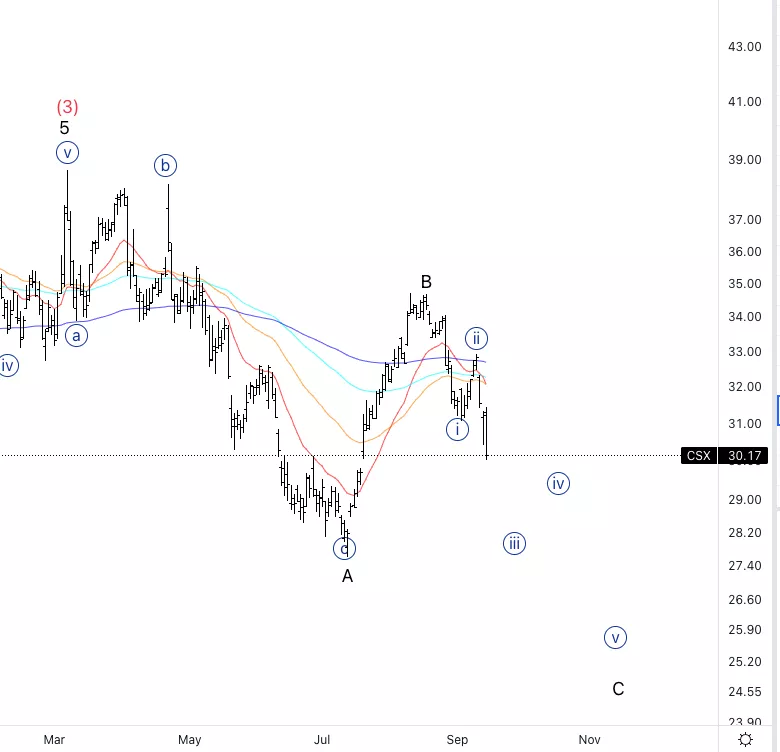
CSX Corp.,(CSX): Daily Chart, September 16 2022,
CSX Stock Market Analysis: Looking for an overall continuation lower, with a potential top in place for wave B.
CSX Elliott Wave count: {iii} of C.
CSX Trading Strategy: Start building shorts with a stop below wave B.
CSX Technical Indicators: We are below all averages which support the bearish scenario.
(Click on image to enlarge)
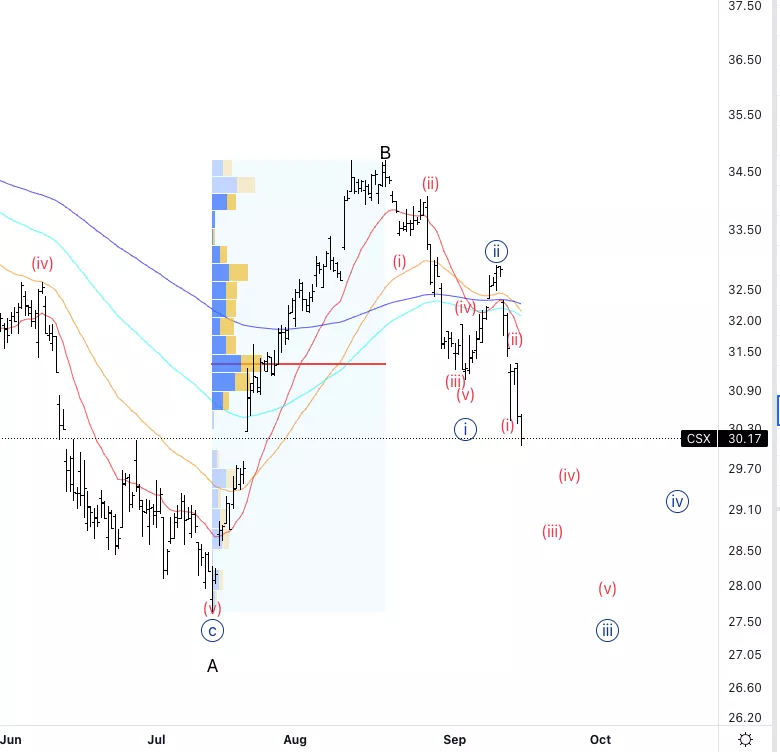
CSX Corp., HON: 4-hour Chart, September 16 2022
CSX Corp., Elliott Wave Technical Analysis
CSX Stock Market Analysis: Looking for further downside to unfold fairly quickly. If we are in wave (iii) of {iii} then we should see a quick move down.
CSX Elliott Wave count: (iii) of {iii}.
CSX Technical Indicators: Below all averages as well as we already went past the volume point of control.
CSX Trading Strategy: Slowly building shorts, an aggressive stop would be below wave {ii}.
(Click on image to enlarge)
More By This Author:
Elliott Wave Analysis: U.S. Indices - Friday, Sept. 16
Elliott Wave Technical Analysis - Binance Coin
Elliott Wave Analysis: European Indices


Comments
Log in or sign up to join the conversation.