
Cryptocurrencies have taken a spill in the last 24 hours, with Bitcoin (BITCOMP) sliding from over $41,000 to below $38,000.
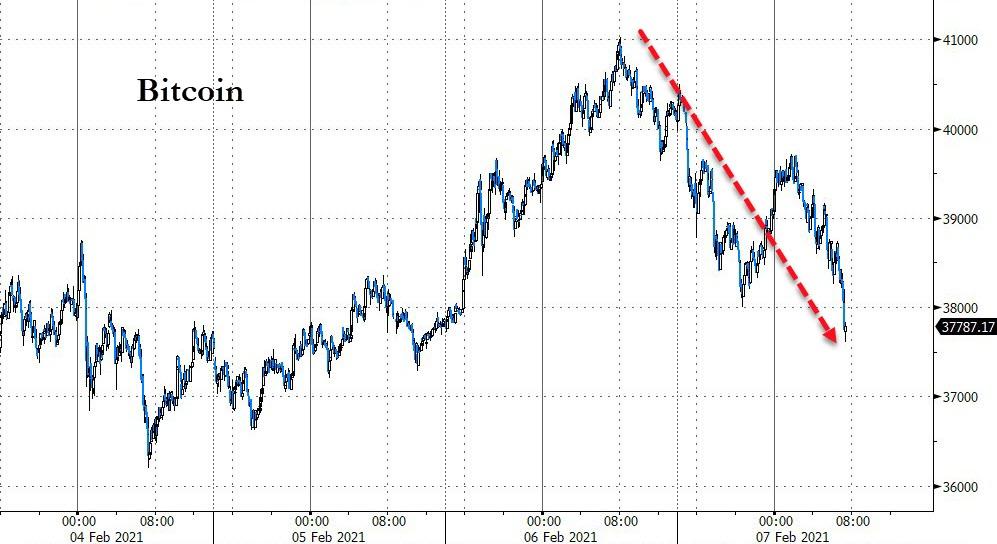
Source: Bloomberg
Additionally, Ethereum (ETH-X) has erased some its recent spike gains quite quickly.
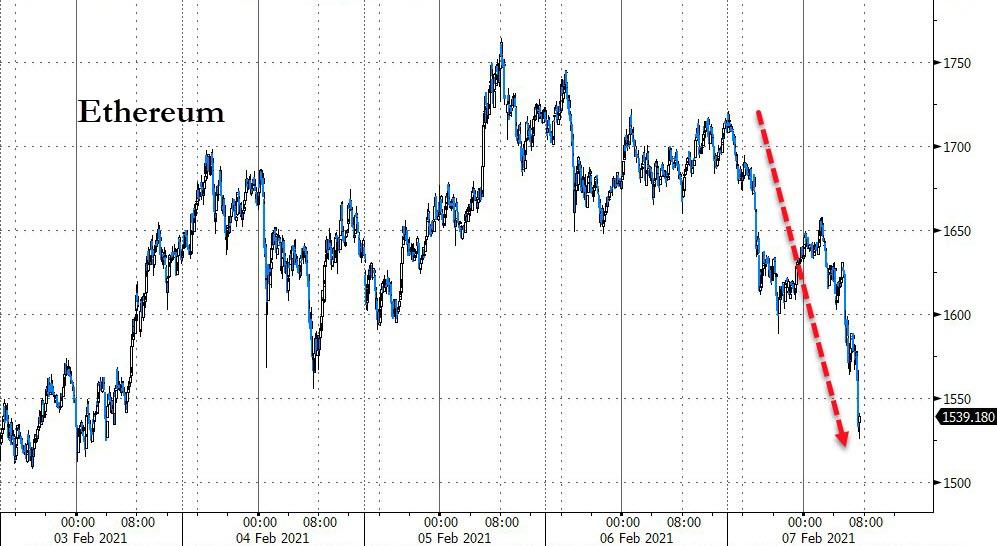
Source: Bloomberg
As Decrypt reports, it's worth noting that Ethereum’s crash comes a day before the Chicago Mercantile Exchange launches ETH futures. The CME’s futures are thought to bring a bucket-load of money to Ethereum since it comprises a regulated, efficient way for institutional investors to speculate on the future price of the coin.
It could also be the case that traders are exiting their positions ahead of the listing; CME's ETH futures contracts make it a lot easier for institutional investors to short ETH—in other words, bet against it.
CME launched Bitcoin futures on Dec. 17, 2017, the day after Bitcoin hit its highest price for that bull run, $19,015. Thereafter, Bitcoin's price tumbled downhill, marking the end of the bull run. That said, 2021's crypto market doesn't look a lot like 2017.
“A retest of $1,450 was always going to happen, with or without CME,” one trader told Decrypt, who thinks that the worst is yet to come. Others see opportunity in the dip. "I feel like I need to take the plunge," said another. "I've been delaying this decision 'for a better time.'"
But, while the major coins are suffering, the retail-frenzied 'GameStop effect' now seems to be spilling over to digital assets like Dogecoin (DOGE-X) and Ripple (XRP-X) through r/Wallstreetbets’ crypto wing, r/Satoshistreetbets. Jay Hao, CEO of crypto exchange OKEx, told Cointelegraph that there is a deeper cause driving this current phenomenon:
“There is a great sense of injustice about some of the opaque practices of Wall Street and the unfair distribution of wealth. I believe that more and more of society is beginning to wake up to this fact, particularly with the K-shape recovery that we are seeing in which high-net-worth individuals have increased their wealth during the pandemic. With more platforms allowing retail investors direct access to invest in equities, we are seeing a democratization of the investment space and more power in the hands of the people.”
Ben Zhou, CEO of cryptocurrency exchange Bybit, told Cointelegraph:
“The recent feats of r/wallstreetbets have made social media and Reddit users realize how powerful a force a decentralized online community can be when they put their mind to it. The ongoing legal troubles of XRP’s parent company Ripple Labs have rinsed out much of the shorts and made the gambit easier to execute, while the jocular nature of DOGE means it’s likable and easy to root for — thus in both cases there was not an immediate selling power to counter the pump.”
This is combined with Elon Musk's recent "meme"-ing efforts which have sent DogeCoin ripping higher.

However, CoinTelegraph warns that investors should pay attention to the "hype-to-activity ratio" - an important metric currently, as it measures the number of tweets a particular coin has about it per each $1 million in reported trading volume.
As The Tie’s Frank told Cointelegraph, the average hype-to-activity ratio for cryptocurrency markets is 1.02, which essentially means that on average, cryptocurrencies see 1.02 tweets per $1 million in reported trading volume. Frank further elaborated on the way in which this ratio can be used as an indicator:
“High Hype-to-Activity ratios may suggest that a particular cryptocurrency is over-hyped in social conversations relative to the amount of trading activity that it has. It is a good metric for identifying outliers or for tracking the number of social conversations a particular coin has relative to its trading volume over time.”
The coins that make the top of the ranking are possibly the most over-hyped coins in the cryptocurrency industry, according to the metric from The Tie. In addition, Zhou mentioned that retail investors are the most susceptible to these schemes:
“Pump and dump schemes trap uninformed retail investors when they, for the fear of missing out a payday, enter the market, only to find themselves captured by a lower price before they even realize.”
However, it's very far from just retail that's playing here as veteran fund manager Bill Miller says he will invest in the Grayscale Bitcoin Trust (GBTC) through its flagship fund, the Miller Opportunity Trust (LMOFX). “The Fund may seek investment exposure to bitcoin indirectly by investing in the Grayscale Bitcoin Trust, an entity that holds bitcoin,” the fund wrote in a filing with the U.S. Securities and Exchange Commission.
“The Grayscale Bitcoin Trust invests principally in bitcoin. The Fund will not make any additional investments in the Grayscale Bitcoin Trust if, as a result of the investment, its aggregate investment in bitcoin exposure would be more than 15% of its assets at the time of investment.” Miller Opportunity Trust had assets under management of $2.25 billion as of Dec. 31, 2020, making the fund’s potential maximum investment in GBTC $337 million.
So What Happens Next?
Bitcoin again hit nearly $41,000 this weekend. By doing so, it nearly reached the previous highs from Jan. 8 just above $41,500. Whenever an asset hits the area of previous highs, it is time to pay close attention. New highs that sustain, news highs that fail, a double top or a lower high with deep-reaching, corrective consequences, or a pause that refreshes before further new highs are made down the road. These are all things to consider.
What do the charts suggest at this stage of this momentum play? First off, the recent near vertical move has hit a zone of technical resistance, coinciding with the 3.618 fib:
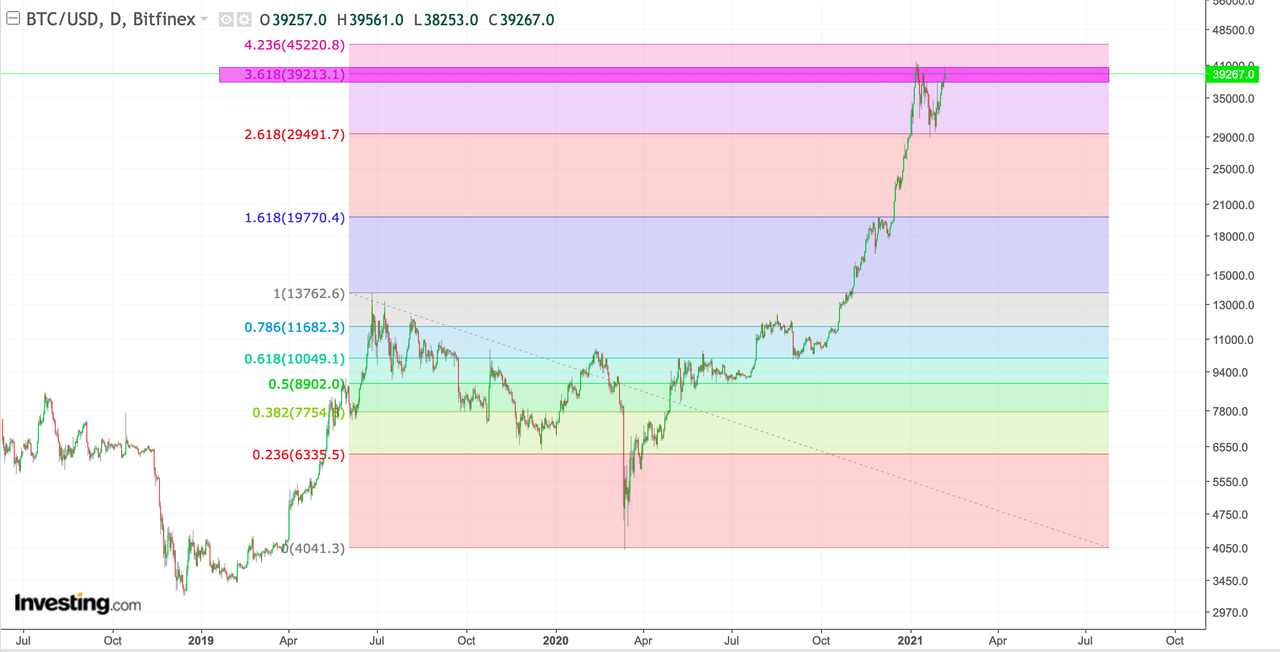
The most recent drop has found support at the 2.618 fib. The confluence of support and resistance of both fibs suggest that the fibs have relevance. As such, Bitcoin needs to break through the 3.618 fib with conviction to tackle the next zone at $45220. Failure to do so risks a larger reversal that breaks below the 2.618 fib.
Historical behavior suggests that sustained new highs may be a critical task for the next few hours and days here in February. Why? Because the chart structure looks eerily similar to 2017/2018:
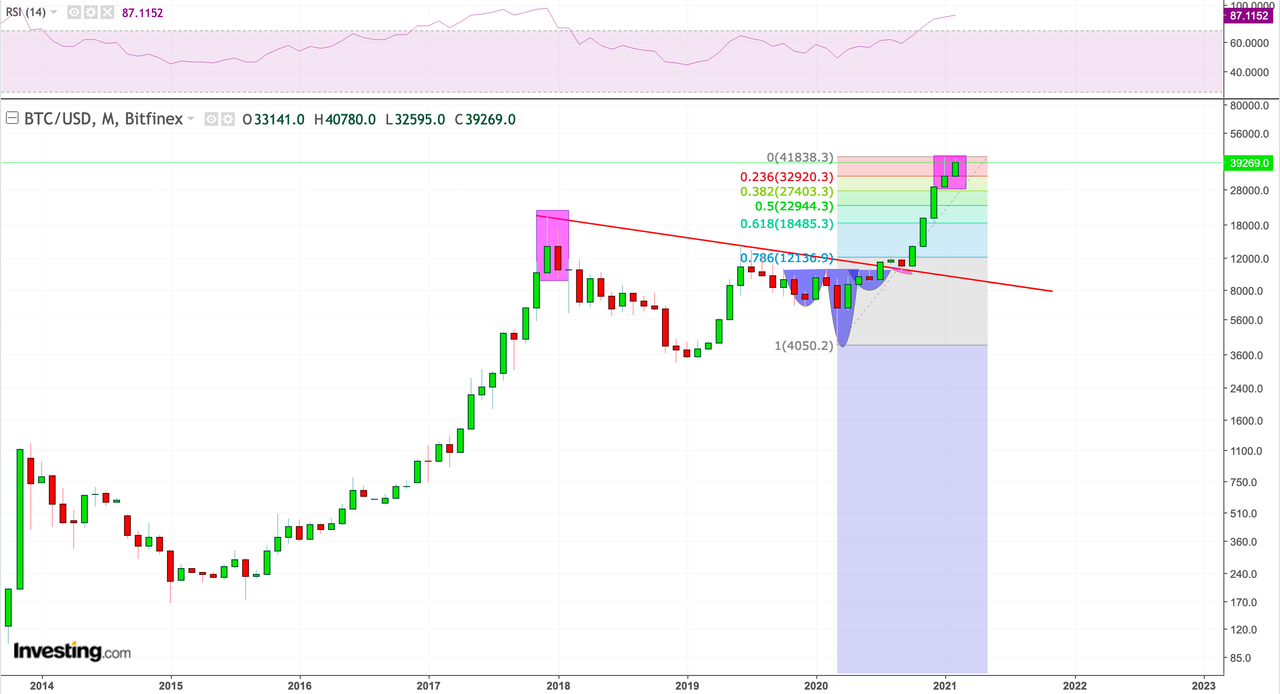
A monthly rejection candle and risk of a lower high in the month following. In 2018, this was deadly as Bitcoing dropped from near $20,000 to below $4,000 in the months that followed. The following weekly chart highlights the similarity in the structure:
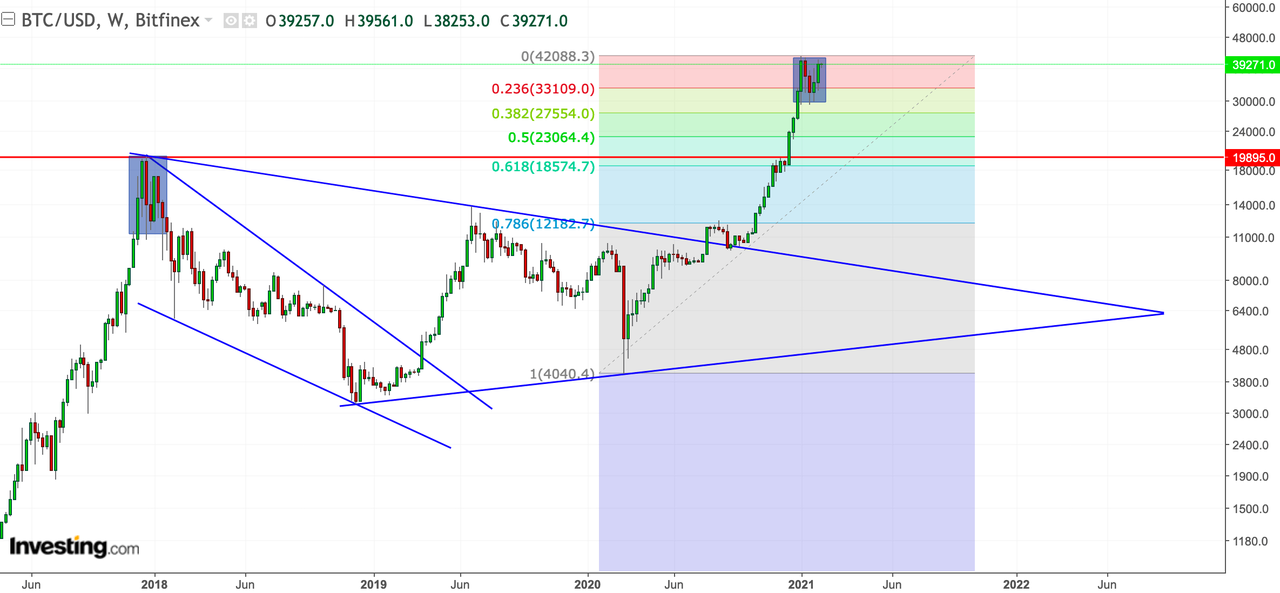
Thus, new highs are key to invalidate the similarity in the structure. And to be clear, if the structural takes on a similar path, the 2017 highs could very well be the next target lower. Failing that, the confluence interjection of key trend lines may ultimately yield a target of around $6400 in 2022.
This is perhaps good news for people who missed the current rally and want a better entry point, but that’s all theorem for now as nothing has broken and the bull case remains intact. Be mindful that confluence areas may end up becoming technical targets.
One other notable red flag is seen on the following chart. Note the building negative divergence as Bitcoin approached the Jan. 8 highs:

That could be problematic. Even if Bitcoin does make new highs, the negative divergence would be very pronounced. Frankly, Bitcoin buyers have a couple of key issues to watch in the days/weeks ahead.


Comments
Log in or sign up to join the conversation.