

In this series, we scale-back and look at the broader technical picture to gain a bit more perspective on where we are in trend. Crude oil prices have collapsed nearly 40% from the October high with the decline now testing a critical long-term technical support confluence. Here are the key targets & invalidation levels that matter on the WTI weekly chart heading into the close of the year.
CRUDE OIL WEEKLY PRICE CHART (WTI)
(Click on image to enlarge)
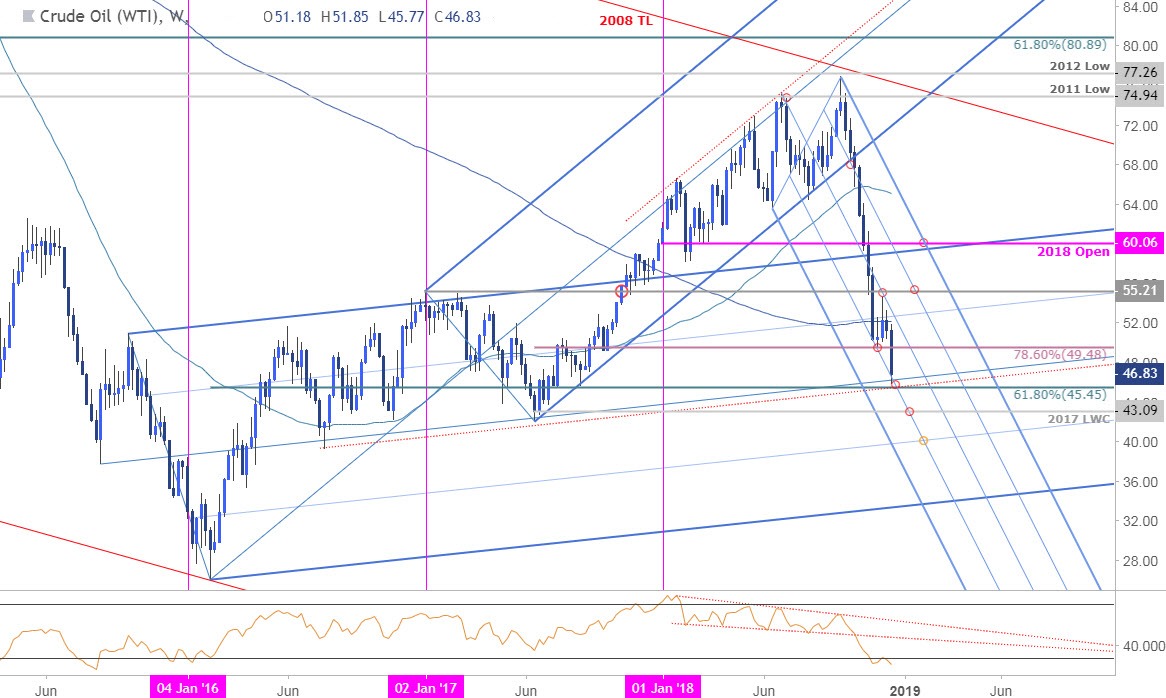
Notes: In last month’s Crude Oil Weekly Technical Outlook we noted that the risk remained lower in price while below 55.21 with our focus on a, “more significant support zone at the median-line of the 2015/2016 slope / 61.8% retracement at 45.45-46.24.” Oil registered a low at 45.77 this week and the focus heading into the close of the year is on whether price can stabilize above this key confluence support threshold.
Interim resistance stands at 49.48 backed by the median-line, currently around ~52- a breach/close above this level would be needed to alleviate further pressure with such a scenario targeting 55.21 and key yearly open resistance at 60.06. A break lower from here would risk substantial losses for crude with subsequent support objectives eyed at the 2017 low-week close at 43.09 and the highlighted slope confluence near the 40-handle.
Bottom line: Crude is testing a Big level here at confluence Fibonacci support and leaves the broader short-bias vulnerable near-term while above 45.45. From a trading standpoint, a good spot to reduce short-exposure / lower protective stops. Look for some back-and-fill here but we’ll want to see weekly momentum recover from the oversold extremes before looking for opportunities on long-side. For now, keep an eye out for downside exhaustion while above this key zone.
CRUDE OIL TRADER SENTIMENT
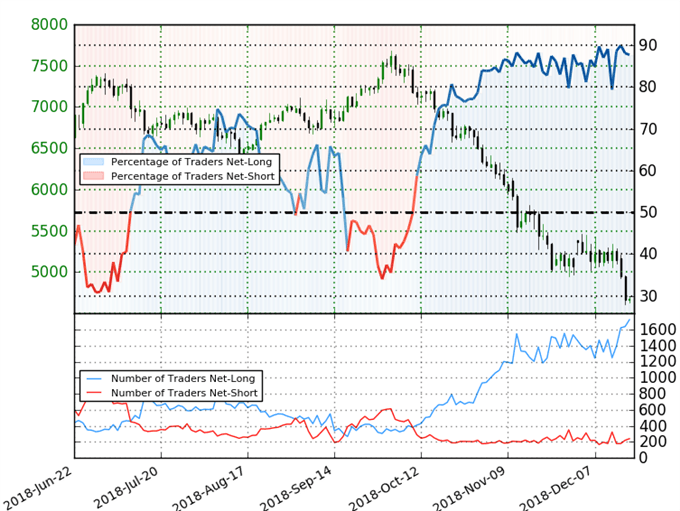
- A summary of IG Client Sentiment shows traders are net-long Crude Oil - the ratio stands at +7.15 (87.7% of traders are long) –bearish reading
- Traders have remained net-long since October 11th; price has moved 38.0% lower since then
- Long positions are 11.2% higher than yesterday and 31.1% higher from last week
- Short positions are 5.7% higher than yesterday and 1.2% lower from last week
- We typically take a contrarian view to crowd sentiment, and the fact traders are net-long suggests Oil - US Crude prices may continue to fall. Traders are further net-long than yesterday & last week, and the combination of current positioning and recent changes gives us a stronger Crude Oil-bearish contrarian trading bias from a sentiment standpoint.



Comments
Log in or sign up to join the conversation.