

In this series, we scale-back and look at the broader technical picture to gain a bit more perspective on where we are in trend. Crude Oil is down more than 2.7% from the weekly open with price now testing key near-term support - here are the key targets & invalidation levels that matter on the WTI weekly chart.
CRUDE OIL WEEKLY PRICE CHART (WTI)
(Click on image to enlarge)
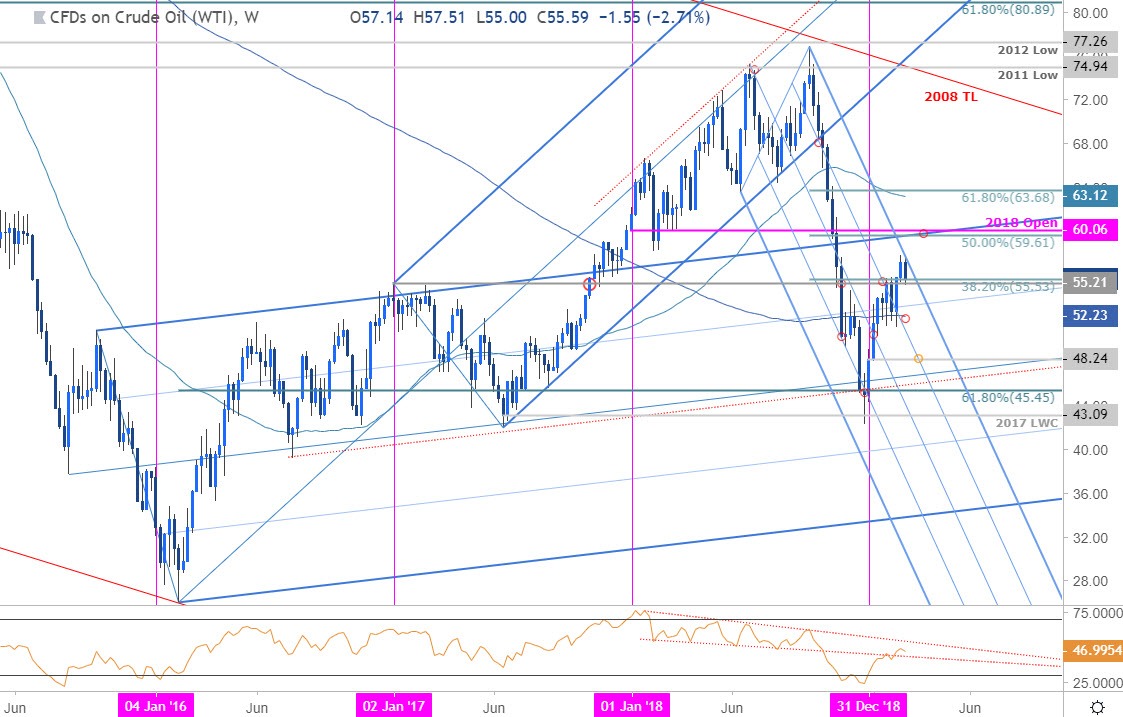
Notes: In last month’s Crude Oil Weekly Technical Outlook our ‘bottom line’ noted that we were, “looking for support on a larger pullback towards the median-line to offer more favorable long-entries with our broader focus weighted to the topside while above 46.91.” Price registered a low at 51.22 before breaking through resistance at the monthly opening-range highs with the advance turning from pitchfork resistance early this week.
Immediate support is eyed here at the 55.21/53 pivot zone- a break / close below would threaten a larger decline targeting the 200-week moving average at ~52.23 with critical support eyed at 48.24. A topside breach of this formation / the high-day close at 57.14 targets more a more significant resistance confluence at 59.61-60.06 where the 50% retracement of the October decline and the 2018 open converge on the 2015/ 2016 pitchfork resistance- look for a larger reaction there IF reached. A weekly close above would be needed to suggest that a more meaningful low was registered in December with such a scenario targeting the 52-week moving average / 61.8% retracement at 63.13/68.
Bottom line: Crude oil prices have turned from slope resistance and the focus is on a reaction this week at the 52.21/53 pivot zone. From a trading standpoint, a break below this level would heighten the risk for further losses but ultimately, a larger correction may offer more favorable long-entries with a breach above pitchfork resistance needed to fuel the next leg higher in crude prices. I’ll publish an updated Crude Oil Technical Outlook once we get further clarity on near-term price action.
CRUDE OIL TRADER SENTIMENT
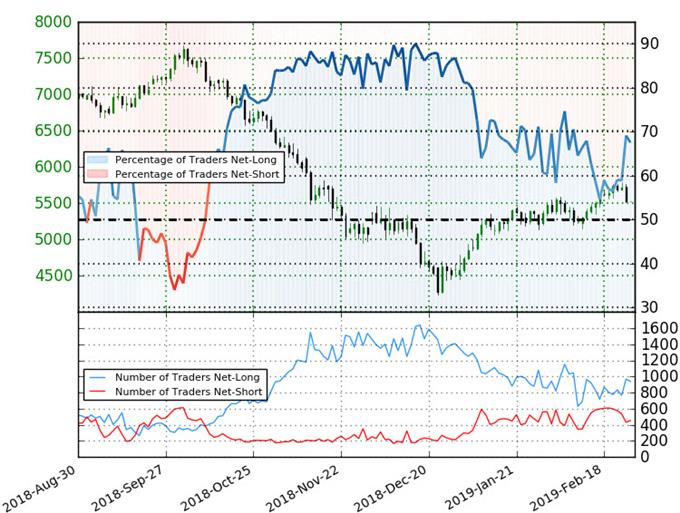
- A summary of IG Client Sentiment shows traders are net-long crude oil - the ratio stands at +2.08 (67.5% of traders are long) – bearish reading
- Traders have remained net-long since October 11th; price has moved 21.2% lower since then
- Long positions are14.8% higher than yesterday and 9.8% higher from last week
- Short positions are 15.0% lower than yesterday and 25.9% lower from last week
- We typically take a contrarian view to crowd sentiment, and the fact traders are net-long suggests crude oil prices may continue to fall. Traders are further net-long than yesterday & last week, and the combination of current positioning and recent changes gives us a stronger crude oil-bearish contrarian trading bias from a sentiment standpoint.



Comments
Log in or sign up to join the conversation.