

As mentioned last week on Twitter, I thought to provide some observations with TPO [time-price opportunities] and volume profiles. We will take a look on the WTI Crude oil market as it seems most traders are in love with this lovely beast. However, you can use this process on any other market as well.
Last week we discussed the importance of assigning a filter process in order to better understand what the larger picture is showing. By going through the periodicity hierarchy of Yearly, Monthly, Weekly timeframes we can understand the higher time frame (HTF) and figure out the path of least resistance. That said, you can use this filter process on TPO/Volume profile charts to find some nice additional levels in the overall macro structure that are confluent with your intra-day trading levels.
When looking at a Volume Profile, we are looking for areas of acceptance and rejection. In acceptance areas market participants are in agreement on price, while in rejection areas, one side of the market participation is not interested in a particular price and quickly rejects these levels. Actually, you could call acceptance areas balance, while rejection areas would be the extremes of that balance. Why identify these areas on a higher time frame now? The answer is quite simple: An intra-day level has less significance than a weekly level or a monthly level because the large market won't recognize the day trader’s sh*tty little whatsoever level when the market rejects the monthly profile's low volume area. This is why it's important to figure out the path of least resistance on a macro scale.
Let's try to visualize this now. Looking at the monthly profiles, we can observe that the market opened inside of the previous month's balanced range and value. The conclusion would be a rotational behavior for this month and to trade the balance extremes of this profile. However, the previous month's high got taken out and we broke out of that balance to trend higher. Here's a screenshot with the mentioned acceptance/rejection areas:
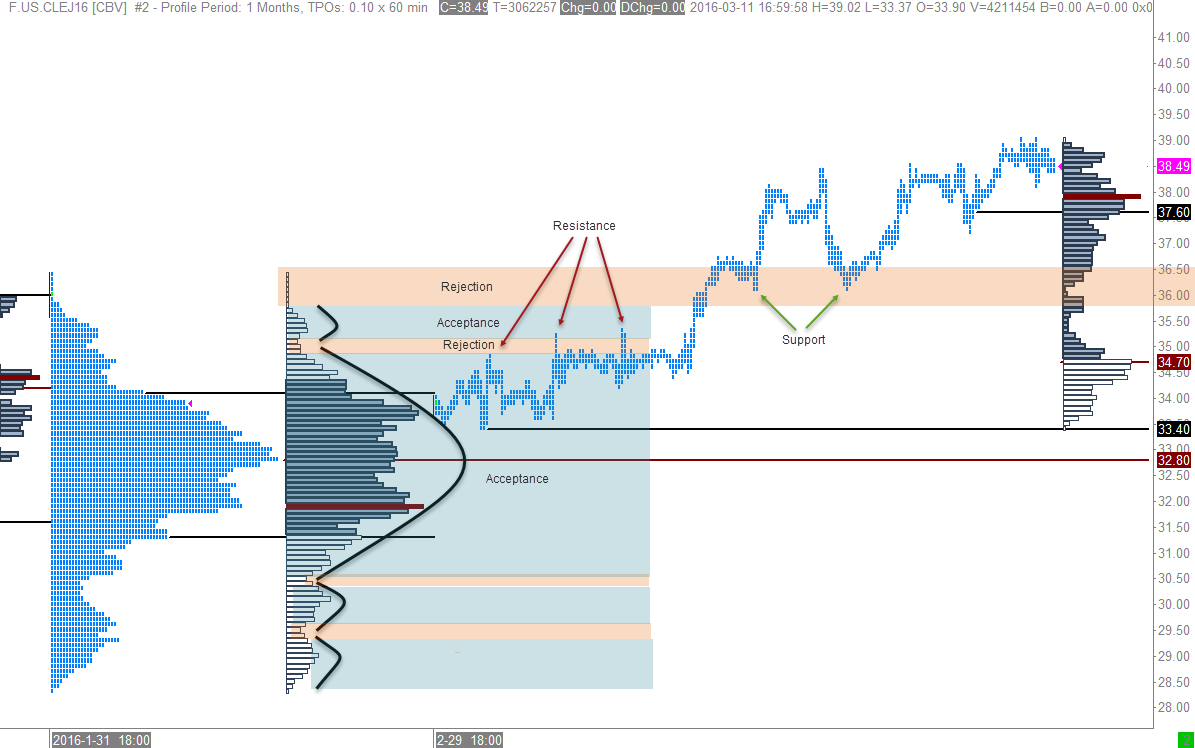
As you can see the rejection areas served as nice support/resistance levels. I also drew the distribution curves into this profile to highlight the acceptance areas (black).
Looking at the current month, we can see a current weak high and low. Also to mention is the weak high back from January. Poor/Weak/Unsecured highs and lows are potential areas to revisit.

Before we getting biased, let's take a look at the weekly profiles. The previous week rejected the previous highs and was quite rotational with a close inside of the time value and above the volume value. Based on where we closed, I plotted some potential scenarios into this chart for the next week. The current unsecured low I would mention as a potential area to revisit.

Moving forward to the daily profiles, we can clearly see our favorite 'P' shaped profile. A P-shaped profile as we know suggests short covering. It seems the market grabbed some liquidity above the highs. With that said, I am quite bearish for the next day. The open and the reaction around value/POC will have a significant effect on how I handle the market. Based where the market closed I would look to short the VPOC with a target around the next liquidity area. A break above could lead us to higher prices obviously.

However, these are my own current views and could change with the time moving forward. Please do you own research because I posted this analysis process just for educational purposes. Moreover it's only one bit of my whole analysis process. I would share some more details but the time is precious. I'm thinking about creating a video or doing a livestream for the next time, since the writing takes so long.
Let's do our best next week!



Comments
Log in or sign up to join the conversation.