


West Texas Intermediate (WTI) Crude Oil trades near $74.50 on Wednesday, up more than 3.5% and extending a rebound that began at the $68.00 floor in early July. The catalyst is depressingly familiar: The US has begun another series of strikes on Iranian military targets in and around the Strait of Hormuz, and President Trump now describes the Versailles agreement as over while allowing talks to limp on. Energy traders spent three weeks selling the peace; they are spending Wednesday buying the war back.
The recursion trade returns
Tehran hit three tankers transiting the strait between Monday and Tuesday; Washington revoked the sanctions waiver behind legal Iranian Oil exports and answered through US Central Command (CENTCOM) with strikes on more than 80 targets, from air defences and coastal radar to anti-ship missile batteries and over 60 Revolutionary Guard small boats. Explosions and power cuts are reported around Chabahar and Konarak on the Gulf of Oman coast, while Iranian state-adjacent media insist the Bushehr nuclear plant took no damage and promise a massive retaliation against US bases in the region.
The pattern now matters more than any single strike: The February war needed six weeks to reach a ceasefire; the Versailles accord broke within a week of its June signature; the latest patch has failed inside ten days, with Tehran already claiming fresh hits on US-linked facilities in Bahrain and Kuwait. Each pause is buying less time than the last, and the tanker lane between Bandar Abbas and the Omani coast keeps hosting the reopening act.
A supply story hiding inside a risk premium
The waiver revocation is the part of Wednesday's news that outlives the headlines. Transactions permitted under the old licence must wind down by July 17, which pulls legal Iranian barrels back off the market just as the British Navy-linked maritime agency lifts the strait's threat level to severe and insurers reprice every hull that transits it. That is physical tightening layered on top of fear, and it is the reason the bid is broadening rather than fading into the afternoon.
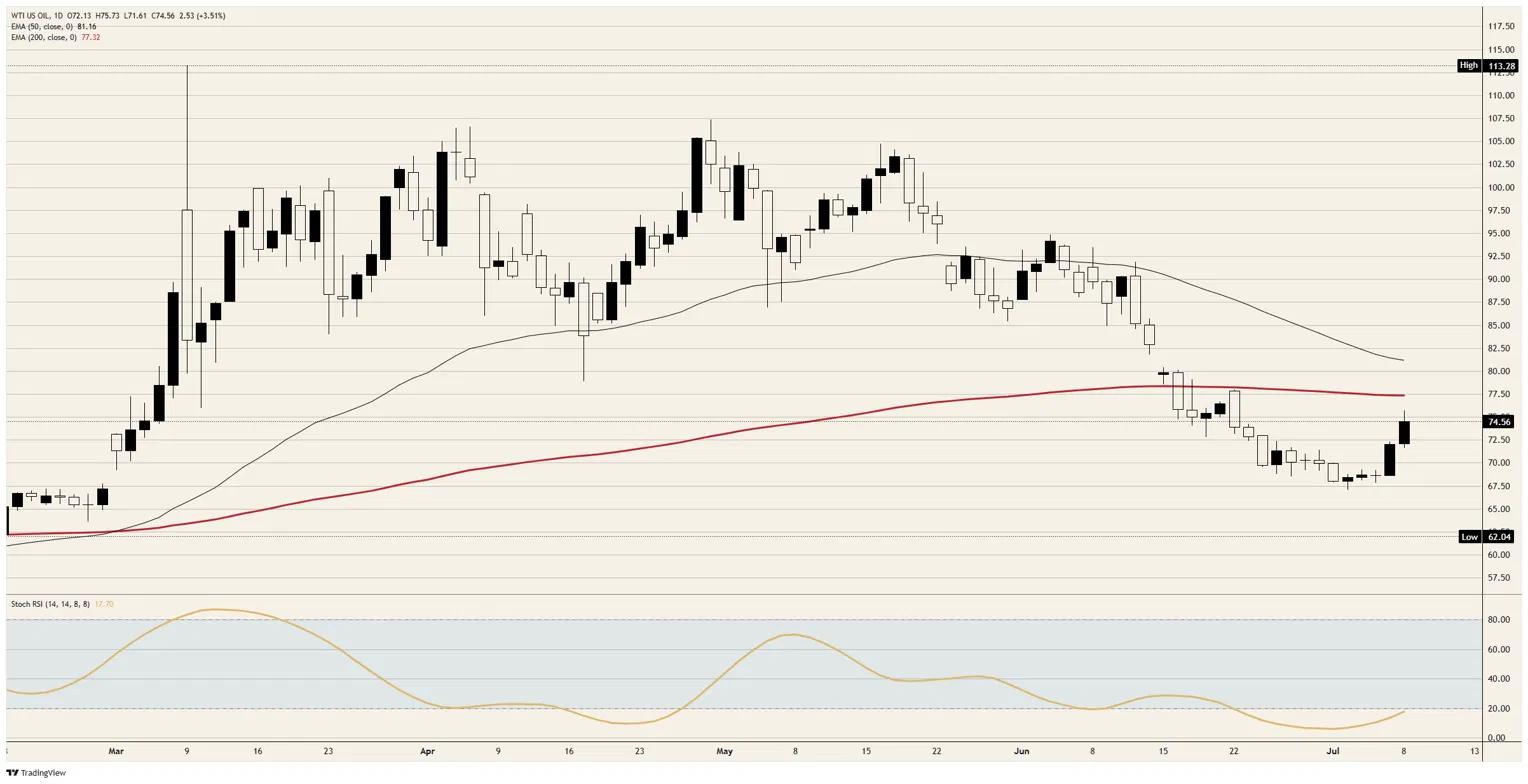
The restraint in the move is still as telling as the move itself. The March closure of the strait ran this chart to a spike high above $113.00; Wednesday's rally stalls below $76.00, under a 200-day Exponential Moving Average (EMA) sitting just shy of $77.50 and miles beneath the 50-day EMA above $81.00. The Organization of the Petroleum Exporting Countries and its allies (OPEC+) lifted August output targets by 188,000 barrels per day only days ago, and hawkish Federal Reserve (Fed) policy leans on demand from the other side, so the market is pricing a rerun of a contained exchange rather than a second full closure.
The cross-asset tape backs the contained-exchange read. Gold trades almost 1% lower even with missiles in the air, sold on hawkish Fed minutes and a firmer Dollar rather than bid as a haven, and equities are absorbing the headlines without panic. When the inflation hedge underperforms the inflation source, the market is calling this an energy shock rather than a systemic one, and Crude Oil is the only asset being asked to carry the war.
The calendar keeps the demand side honest
Thursday brings the Chinese Consumer Price Index (CPI) at 01:30 GMT, with consensus at 1.1% YoY and the monthly print seen at -0.2%, alongside a Producer Price Index (PPI) expected to accelerate to 4.1% from 3.9% as war-inflated input costs pass through factory gates. China is the marginal barrel of global demand, and a soft consumer print would undercut the rally's demand leg just as its supply leg strengthens.
US Initial Jobless Claims follow at 12:30 GMT with 218K expected, while Wednesday's Federal Open Market Committee (FOMC) minutes, released at 18:00 GMT, showed a committee split almost evenly between hikes and holds for the rest of the year. A Fed arguing with itself about tightening into an energy shock keeps every inflation-sensitive release live, and the June US CPI report on July 14 is the next referee. Momentum is at least cooperating with the bounce for now, with the Stochastic Relative Strength Index curling up from oversold territory on the daily chart.
WTI Crude Oil technical levels to watch
Resistance: The session high just below $76.00 is the first hurdle, followed by the 200-day EMA just shy of $77.50; beyond that, the 50-day EMA above $81.00 marks the roof of any recovery corridor.
Support: $72.00 guards Wednesday's breakout, with the early-July floor at $68.00 the level that keeps the rebound alive; the yearly low near $62.00 is the disaster handle underneath.
Bias: Bullish while $72.00 holds; the strait owns the tape and dips are for buying, with only a genuine de-escalation or a daily close back under $72.00 handing control to the sellers.
WTI daily chart



Comments
Log in or sign up to join the conversation.