

Crude oil prices rose after an IEA report said OPEC demonstrated “record compliance” of 90 percent with an output cut deal struck late last year. The group also revised up their 2017 oil demand forecast for the third consecutive month. Gold prices managed a shallow recovery having dropped to a four-day low in what appeared to be corrective price action ahead of the weekend.
Looking ahead, EIA drilling productivity data and OPEC’s monthly report are in focus. The market-moving potential of the self-congratulatory tone likely to be on offer in the latter may have been somewhat diminished by the IEA. The former may temper the bulls’ exuberance however, showing that strong growth in swing production may undermine the cartel’s efforts.
As for gold, it may find it hard to build lasting directional momentum for now as traders look ahead to two days of Congressional testimony form Fed Chair Janet Yellen. If she suggests that December’s forecast envisioning three rate hikes this year still holds, the ebbing appear of non-interest-bearing assets may hurt the yellow metal. A more cautious tone may offer it a lift however.
GOLD TECHNICAL ANALYSIS – Gold prices haven’t found downside follow-through since putting in a Bearish Engulfing candlestick pattern but the topping setup remains valid for now. A break below the 38.2% Fibonacci retracement at 1219.20 on a daily closing basis targets the 23.6% level at 1182.36. Alternatively, a move above the 50% Fib at 1248.98 sees the next upside barrier at 1278.76, the 61.8% retracement.
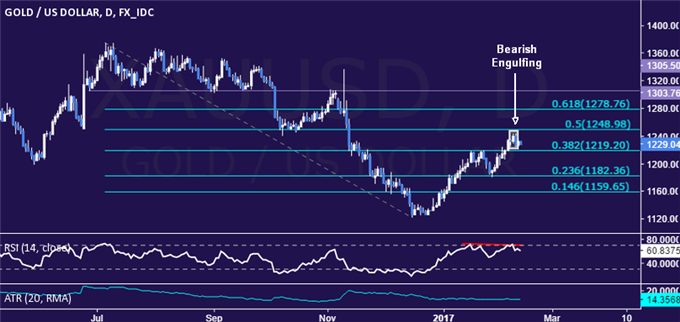
Chart created using TradingView
CRUDE OIL TECHNICAL ANALYSIS – Crude oil prices are back at familiar range resistance capping gains since late December 2016. A daily close above 53.86 targets the 55.21-65 area (January 3 high, 38.2% Fibonacci expansion). Alternatively, a move below rising trend line support at 51.72 opens the door for a test of the 38.2% Fib retracement at 50.25.

Chart created using TradingView



Comments
Log in or sign up to join the conversation.