
Crude oil prices continued to decline, hitting the lowest level in two weeks. Traders seemed to look past API data showing raw material stockpiles shed 4.08 million barrels last week, a far larger draw-down than the 466.1k outflow expected from incoming EIA data, to focus on a build in gasoline storage. That grew by a hefty 4.91 million barrels.
Taken in the context of official statistics, that amounts to the largest gain since January. If this or something close to it shows up in official data due today, worries about sagging demand even after refining capacity is brought back from hurricane-related disruptions may compound selling pressure. For context, analysts’ median forecasts envision a 1.04 million barrel inflow.
Gold prices managed a shallow advance, snapping a two-day losing streak. The perennial anti-fiat asset found support as the US Dollar struggled to maintain upward momentum absent fresh fodder to fuel Fed tightening bets. Gains may be fleeting however if the service-sector ISM survey and the ADP employment growth gauge echo recently upbeat US news flow, rekindling rate hike speculation.
GOLD TECHNICAL ANALYSIS – Gold prices are attempting a cautious recovery after touching two-month lows. A rebound back above the 50% Fibonacci expansion at 1279.01 exposes the 1287.18-88.28 area (38.2% level, September 21 low). Alternatively, a turn below the October 3 bottom at 1268.10 sees the next downside barrier at 1260.74, the 76.4%Fib.
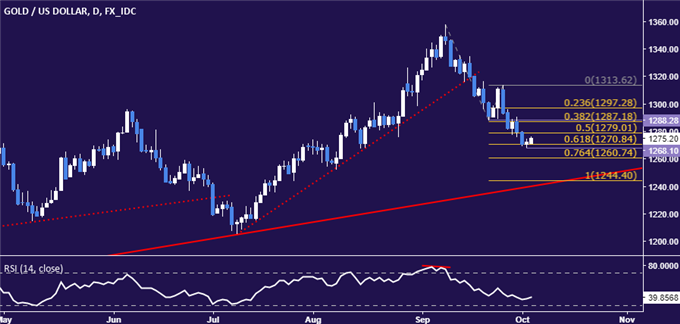
Chart created using TradingView
CRUDE OIL TECHNICAL ANALYSIS – Crude oil prices continue to decline, with sellers now taking aim at support marked by the 38.2% Fibonacci retracementat 48.72. A daily close below that opens the door for a challenge of the 50% level at 47.46. Alternatively, a move back above the 23.6% Fib at 50.29 paves the way for a retest of the 14.6% retracementat 51.26.
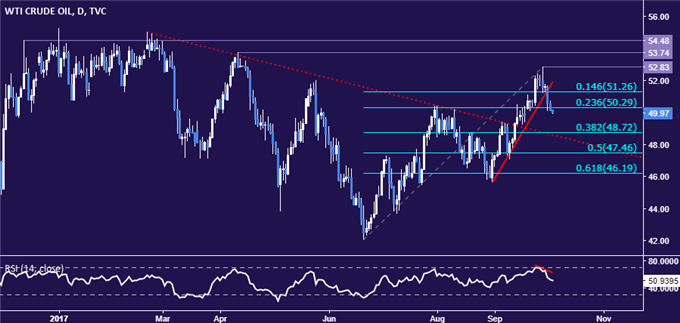
Chart created using TradingView


Comments
Log in or sign up to join the conversation.