
CRUDE OIL CONGESTION AFTER PULLBACK FROM BULLISH TREND
The bullish trend in Oil prices has started to pull back, and this comes after a 2019 theme of strength that saw Oil prices rally by more than 50% from the Q4 lows. Crude Oil pushed up to a fresh six-month-high just a few weeks ago, with buyers rushing to the bid after the US ended Iran’s waiver on Crude Oil Exports.
Ahead of that announcement, Oil prices were already looking overbought, as discussed in the technical forecast for that week. But the weekend announcement brought a quick rally of strength that lasted for the first couple trading days of that week, at which point the pullback got back in order. At this point, each of the support zones mentioned in that article, around 62.84-63.11, 61.58-61.87 and 60.00-60.32 have come into play, helping to cauterize short-term supports as Oil prices have continued to pull back.
US OIL FOUR-HOUR PRICE CHART
(Click on image to enlarge)

Chart prepared by James Stanley
Crude Oil prices have spent most of May digesting, and the past week has brought both lower-highs and higher lows as price action has continued to narrow. This presents a compelling backdrop for volatility expansion as a number of key markets around the world are under more intense focus after this week’s re-emergence of risk aversion. The big question is whether sellers can continue to push after the early-week support test at the key support zone around the $60 handle on the chart. Prices gapped-lower to start this week and made a fast move down into that area, at which point buyers came back in droves to push prices back up to 62.84, which is the 61.8% Fibonacci retracement of the 1998-2008 major move in Oil.
Each of these prices, particularly given recent displays of support/resistance, can be key for forward-looking strategy in Crude Oil.
CRUDE OIL TWO-HOUR PRICE CHART
(Click on image to enlarge)

Chart prepared by James Stanley
OIL PRICE STRATEGY AS CRUDE CONGESTS
At this point, traders should be careful of assigning near-term directional biases to Crude Oil given the continuation of both lower-highs and higher-lows. This element of digestion, particularly after a big move, much less after a retracement from a big move, can bring a plethora of possible scenarios.
Instead, traders may want to look to anticipate reaction. A re-test of support around the $60 handle can re-open the door for topside swing strategies, looking for prices to move back towards the 61.58-61.87 level on the charts. Conversely, a topside push up to re-test resistance from 62.84-63.11 could open the door for short-side swings, but if bulls prod a break above that level, which marks this week’s high, then short-side strategies will no longer offer much attraction; and instead, traders may have a scenario of bullish continuation to work with.
Follow-thru resistance can be sought out at 63.71, and if bulls are able to test that level, the door could re-open for higher-low support in the 62.84-63.11 area on the chart, similar to what happened in the latter-portion of April before sellers pushed prices lower.
CRUDE OIL HOURLY PRICE CHART
(Click on image to enlarge)
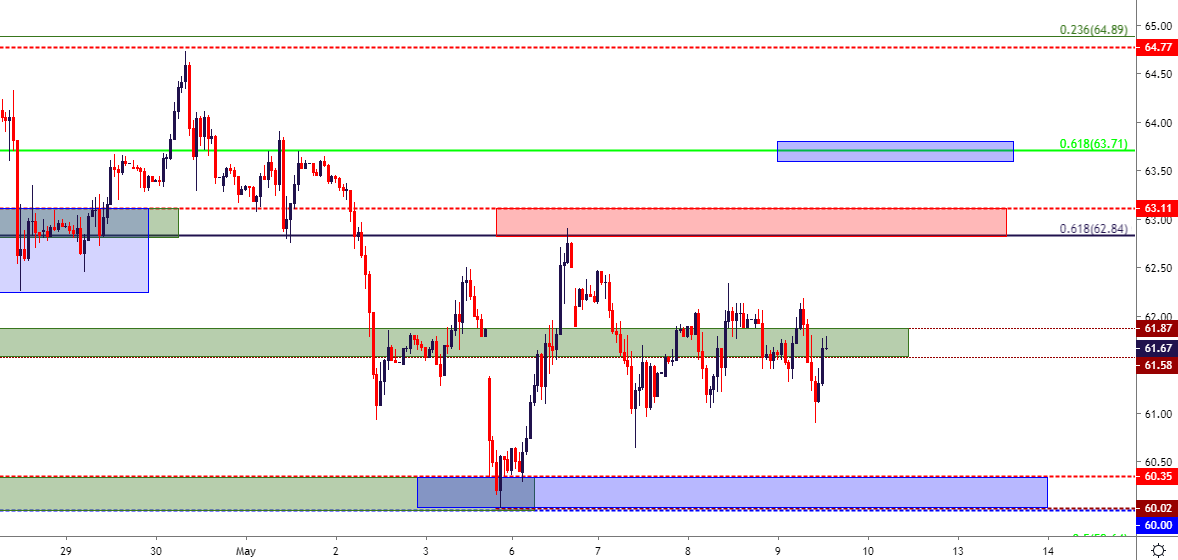
Chart prepared by James Stanley


Comments
Log in or sign up to join the conversation.