

In this technical article, we’re going to take a quick look at the Elliott Wave charts of OIL Futures CL_F.
Understanding how to identify incomplete sequences in Elliott Wave analysis is crucial as they are a key driver of market direction. In this case, crude oil (CL_F) shows an incomplete sequence from the 109.67 high, which keeps the downside pressure in place. Recently, oil price rallied into our Blue Box selling zone. Sellers reacted right at that area, and price started to decline as expected.
In the following analysis, we explain the Elliott Wave forecast, the current oil market outlook, and the trading strategy behind selling rallies from the Blue Box.
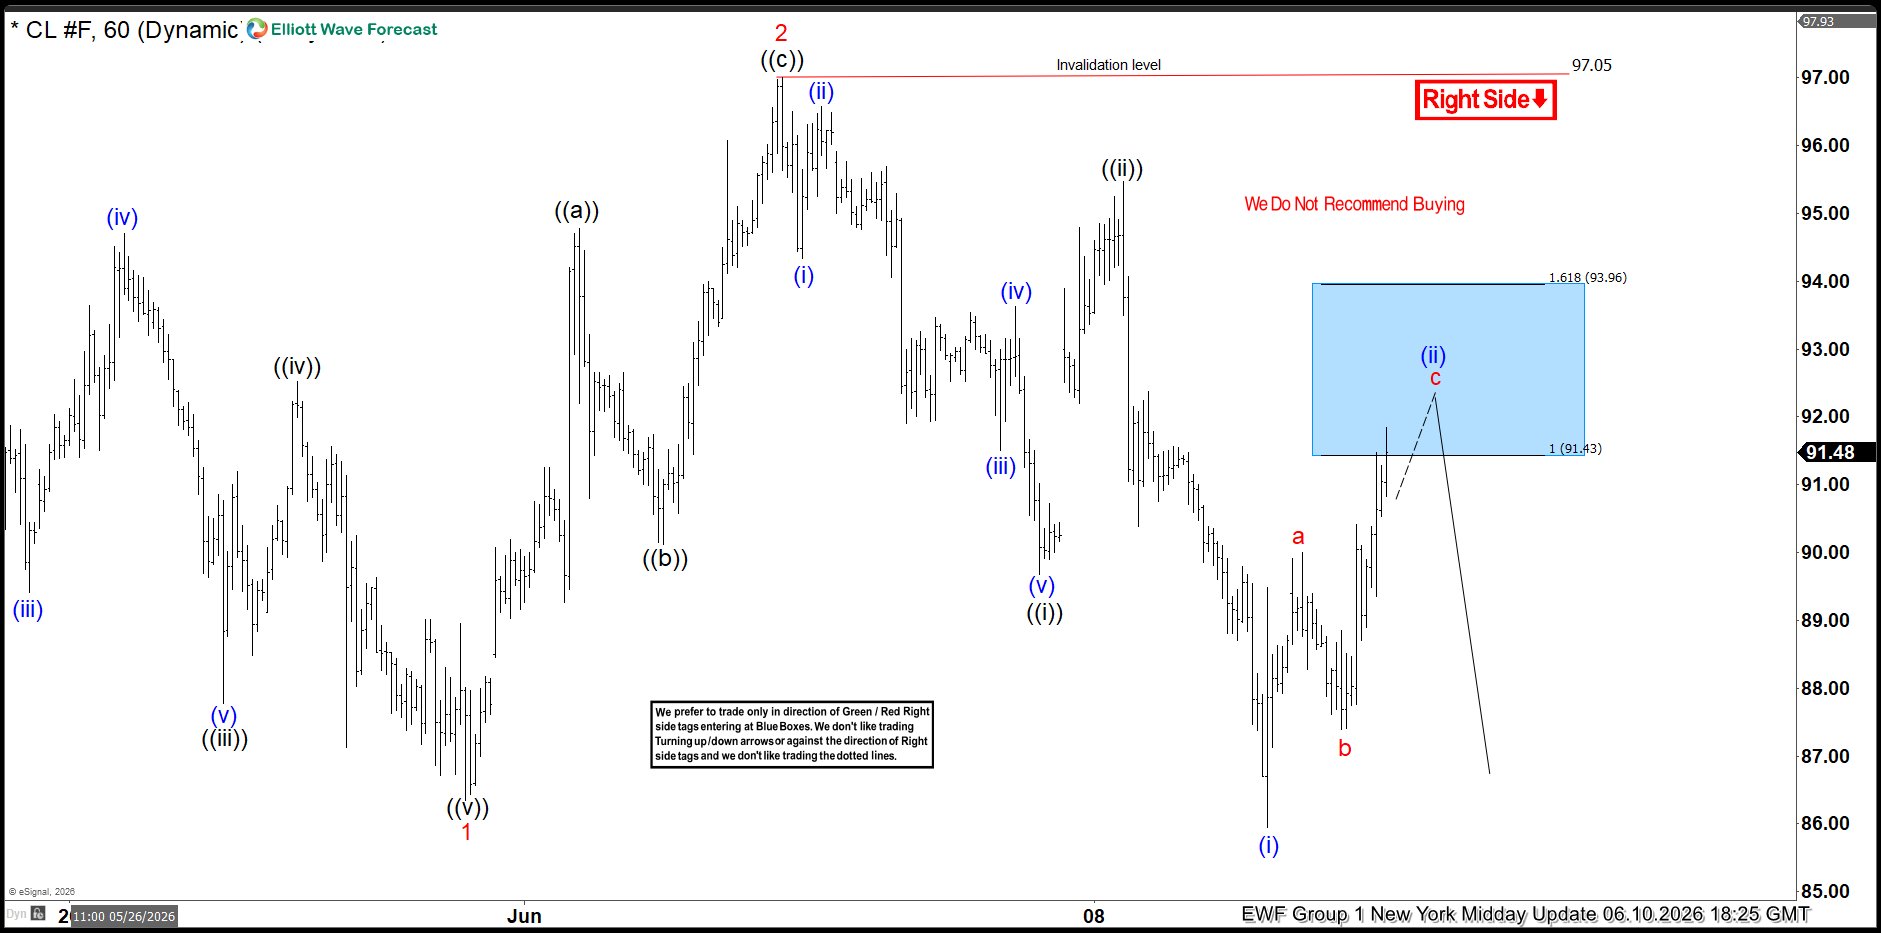
OIL Elliott Wave H1 Chart 06.10.2026
The commodity is giving us a clear 3-wave correction, forming an Elliott Wave Zig Zag Pattern. The price has already reached the extreme zone at 91.43-93.96 (Blue Box – sellers zone). We don’t recommend buying OIL and prefer the short side from the blue box zone. As the main trend is bearish, we expect to see at least a 3-wave pullback from our selling zone. Once the decline reaches 50 Fibs against the (red) low, we will make the short position risk-free (put SL at BE) and take partial profits.
Quick reminder:
Our charts are easy to trade and understand:
Red bearish stamp+ blue box = Selling Setup
Green bullish stamp+ blue box = Buying Setup
Charts with Black stamps are not tradable.
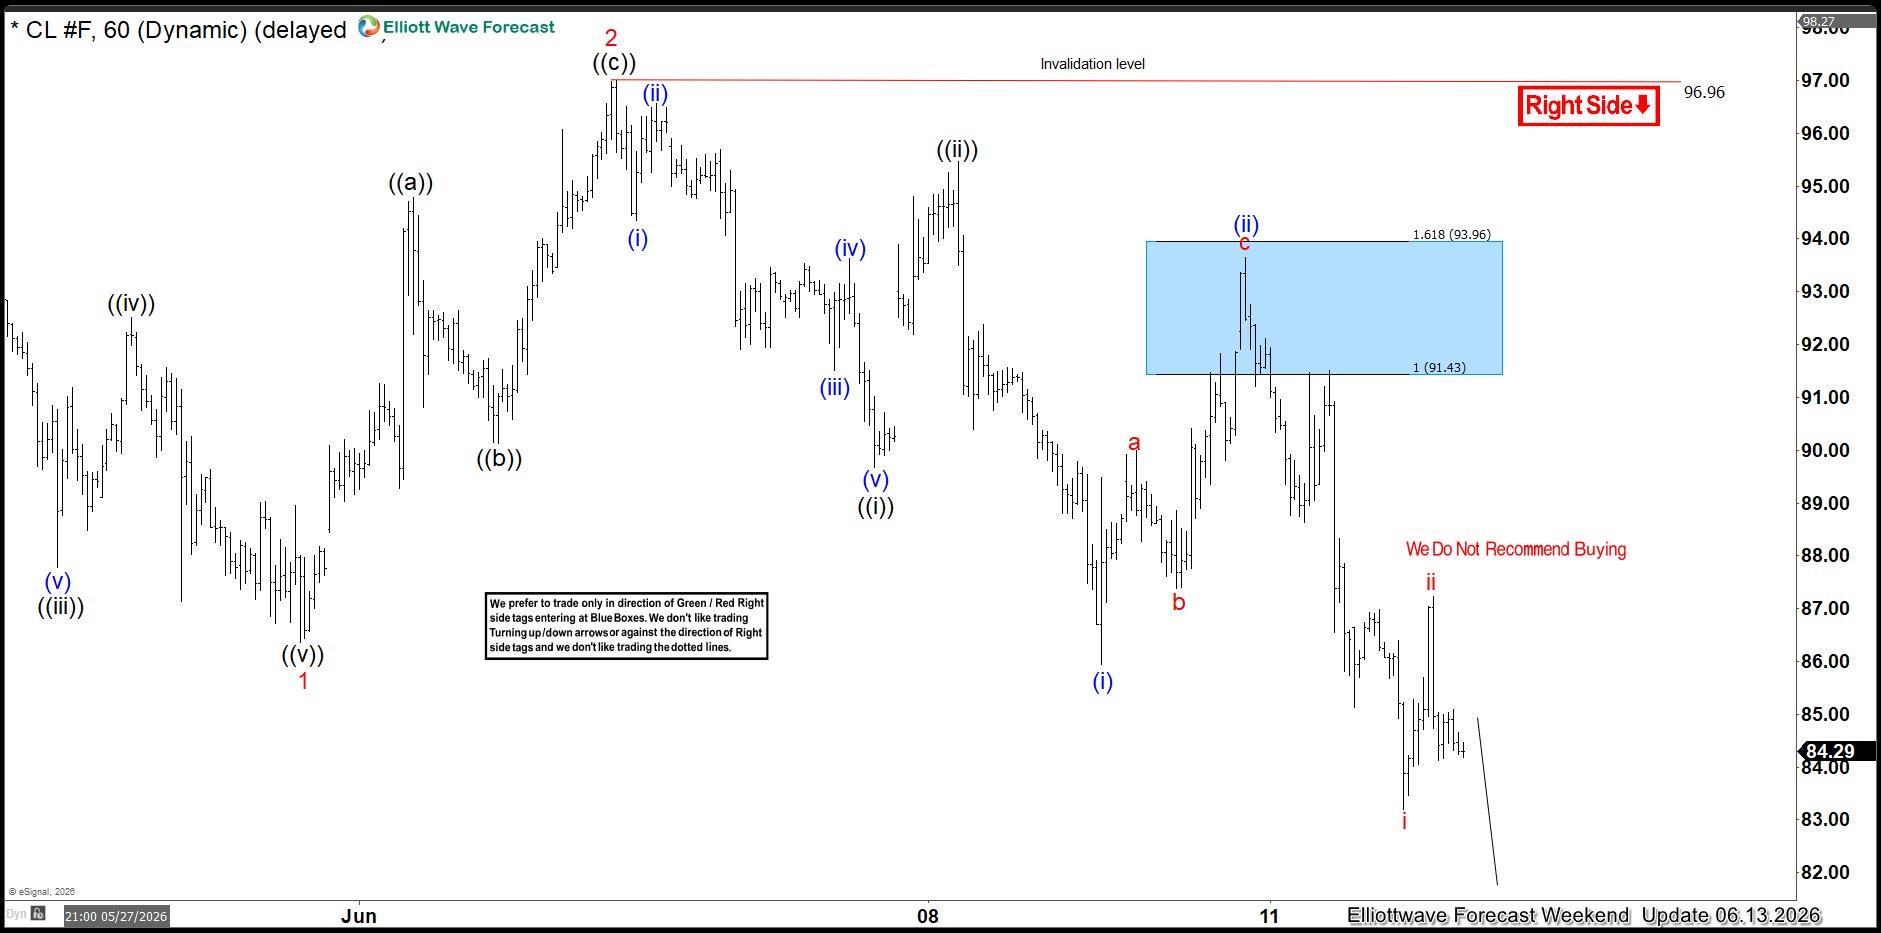
OIL Elliott Wave H1 Chart 06.13.2026
The commodity found sellers at the Blue Box area (91.43–93.96). Price reacted well from this selling zone and turned lower.
The decline pushed to new lows, confirming the bearish view.
Important note: Our analysis is not based on Elliott Wave in isolation. We perform detailed higher-time-frame cycle analysis, which shows an incomplete market structure. This is one of the key drivers of price action, along with correlation analysis and broader market context.


Comments
Log in or sign up to join the conversation.