
Crude oil prices touched a four-year high amid worries that the US will abandon a nuclear disarmament deal with Iran, re-imposing sanctions that crimp global supply. A swift reversal followed however after President Trump said a decision on the matter will be revealed at 18:00 GMT today, four days ahead of a deadline on May 12.
The announcement may have spooked short-term buyers reluctant to hold onto skewed exposure as event risk suddenly looms on the horizon. The subsequent profit-taking brought the WTI contract nearly all the way back to where it started for the session. Meanwhile, gold prices marked time as all eyes turned to a much-anticipated speech from Fed Chair Jerome Powell at a joint SNB/IMF event in Zurich, Switzerland.
POWELL, TRUMP IN FOCUS FOR COMMODITY MARKETS
The central bank chief is due to opine on the impact of monetary policy on global financial conditions. That seems especially appropriate as the Fed’s own tightening efforts spill over into higher borrowing costs beyond US borders. Mr. Powell seems likely to signal that such knock-on effects will not easily deter stimulus withdrawal, which may boost the US Dollar the expense of commodities at large.
A stronger greenback bodes inherently ill for anti-fiat alternatives epitomized by gold. Crude oil may likewise suffer, although Mr. Trump’s decision on Iran may overshadow other considerations in the near term. Weekly inventory flow statistics from API and the monthly short-term energy outlook report from the EIA are in focus on the data front.
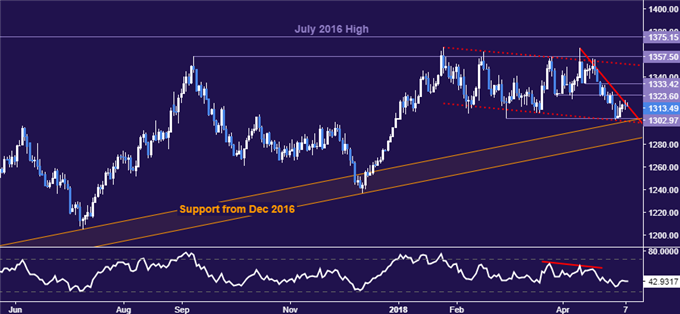
GOLD TECHNICAL ANALYSIS
Gold prices stalled at trend line resistance defining the down move from the April 11 high. A daily close above this barrier – now at 1314.47 – paves the way for a retest of former support at 1323.60. Alternatively, push below the support cluster in the 1301-03 area would open the door for a challenge of long-term trend support guiding prices higher since December 2016.
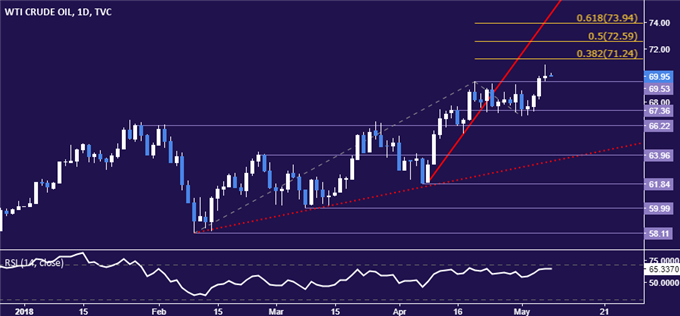
CRUDE OIL TECHNICAL ANALYSIS
Crude oil prices continue to eye resistance marked by the 38.2% Fibonacci expansion at 71.24 after taking out the April 19 high at 69.53. A break upward confirmed on a daily closing basis exposes the 50% level at 72.59. Alternatively, a move back below 69.53 puts the range floor at 67.36 back in the spotlight.


Comments
Log in or sign up to join the conversation.