
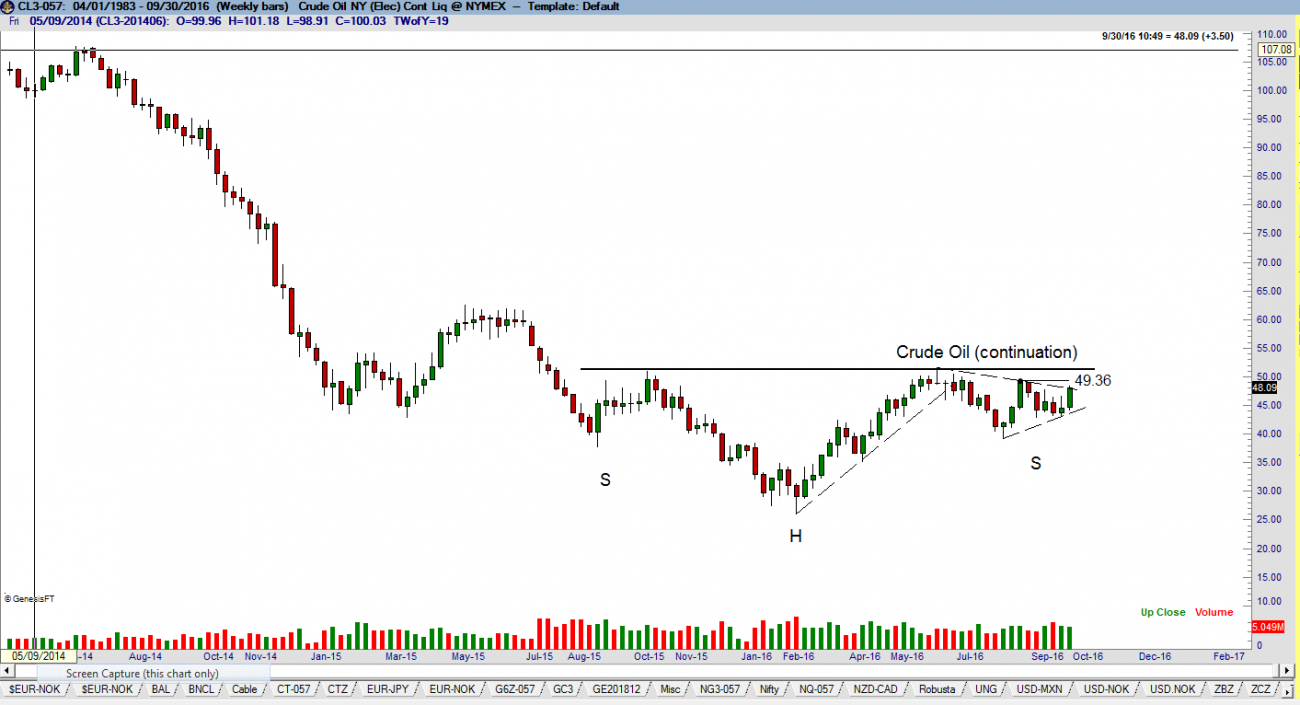
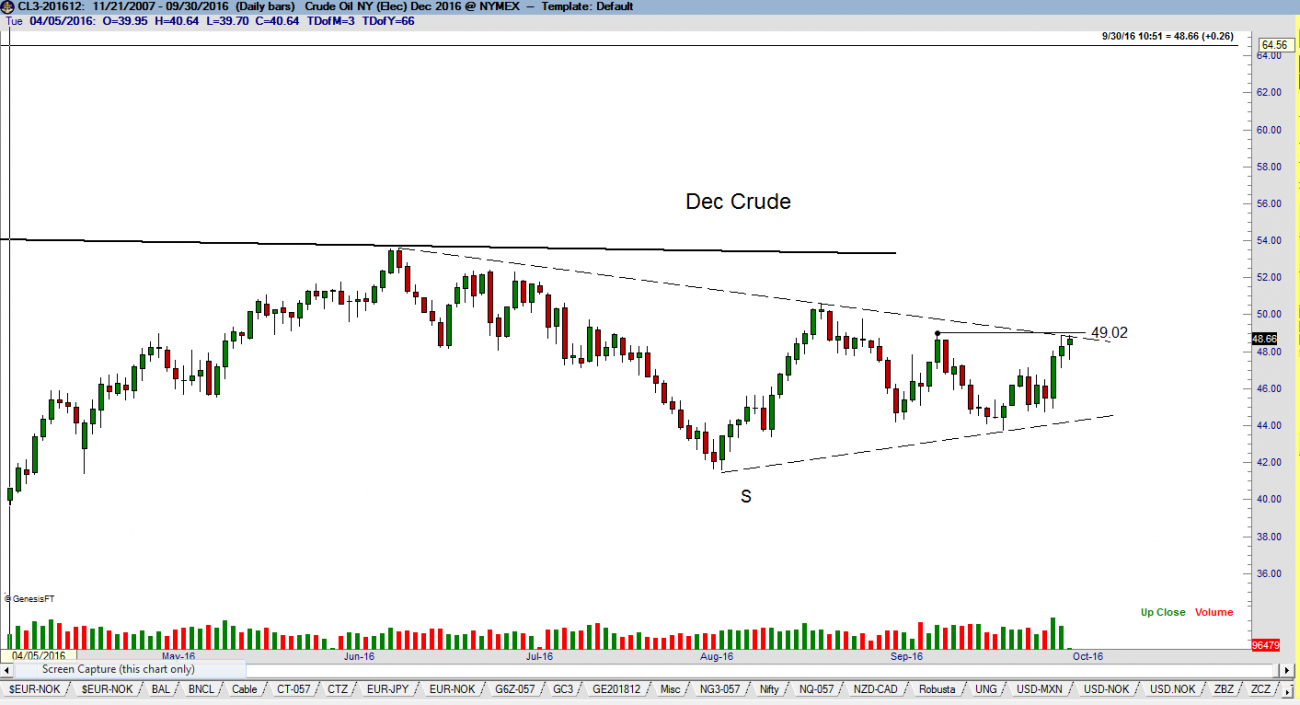
The weekly continuation graph (Crude Oil) continues to form a possible 14-month inverted H&S bottom pattern and is flagged as a Developing Trade possibility. Notice that the right shoulder has taken the form of a possible symmetrical triangle on both the continuation and Dec contract charts. A close by the Dec contract above 49.00 would represent a buy signal, although diagonal patterns (symmetrical triangles included) lack reliability. Factor is flat.
(Click on image to enlarge)
(Crude Oil – Daily)
(Click on image to enlarge)


Comments
Log in or sign up to join the conversation.