
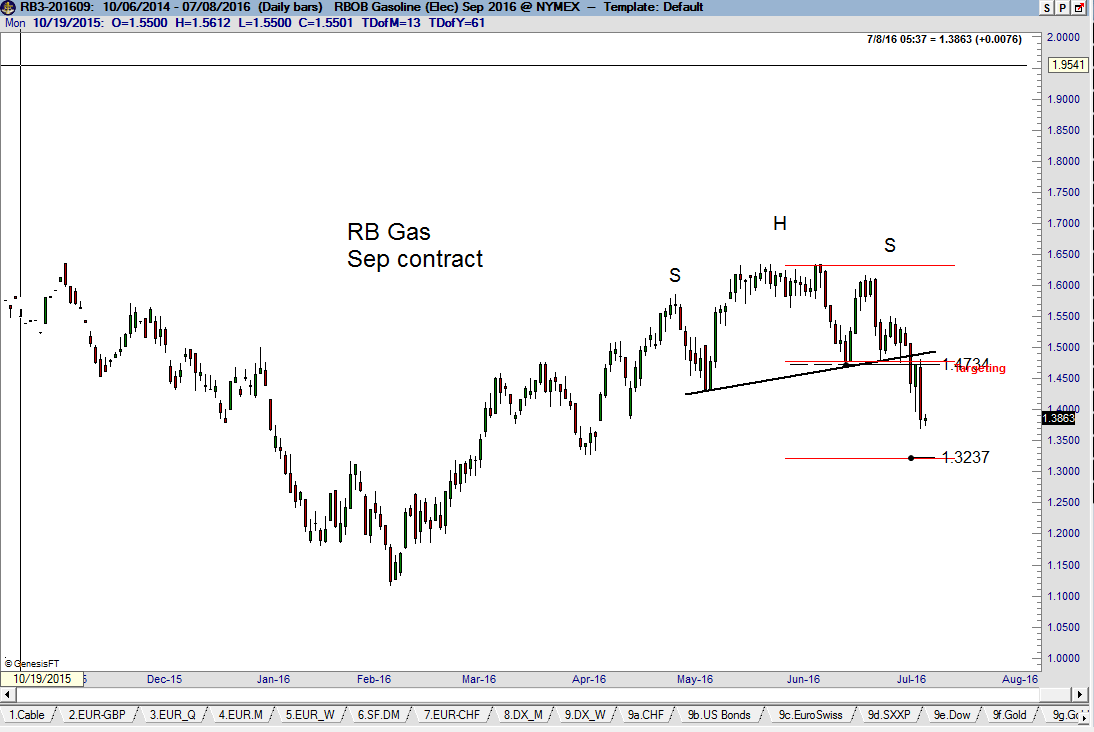
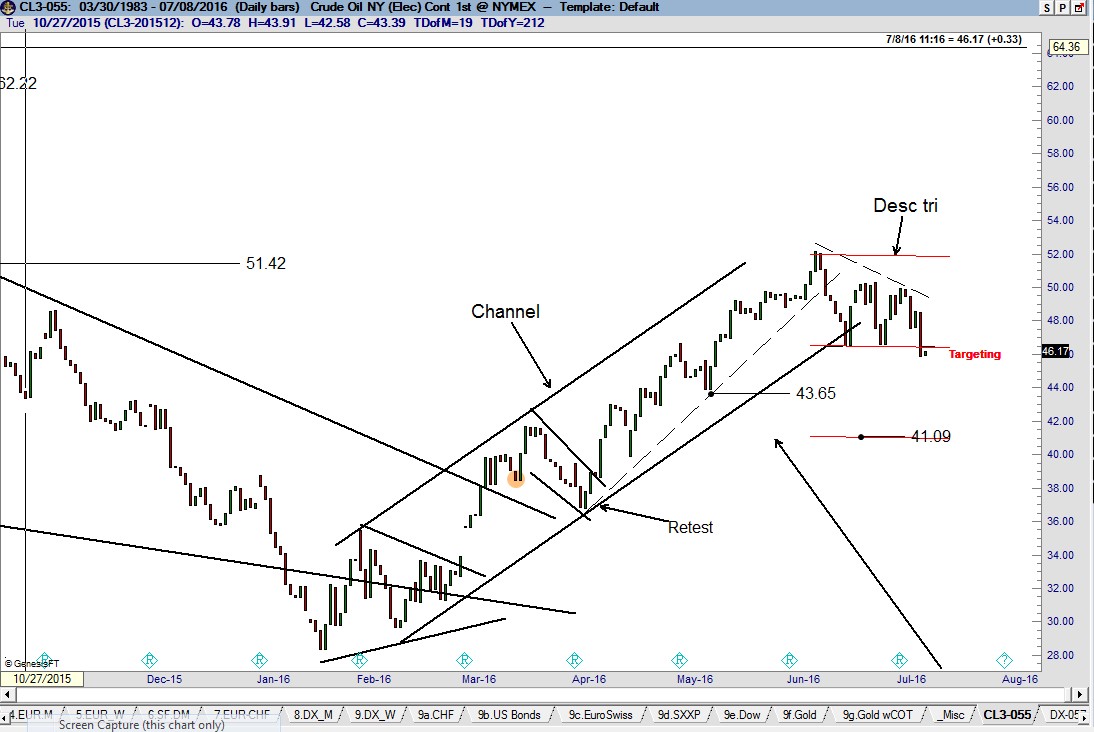
Crude Oil is descending out of a triangle pattern.The daily graphs show clear signs of topping in the energy markets. The daily graph of Sep RB Gas has completed an 11-week H&S top pattern with a target of 1.3237.
(Click on image to enlarge)
A couple of observations on daily continuation graph (true range) of Crude Oil are worthy of note. First, the 5-month up channel from the late Jan lows has been clearly violated. The breaking of an advancing trendline (lower boundary of a channel) is never a bearish signal in and of itself. Trendline breaks are simply an indication that the behavior of a market is changing. Second, the Crude Oil decline on Jul 7 completed a small descending triangle top with a target of 43.65, then 41.09. Factor is short Crude Oil.
(Click on image to enlarge)


Comments
Log in or sign up to join the conversation.