

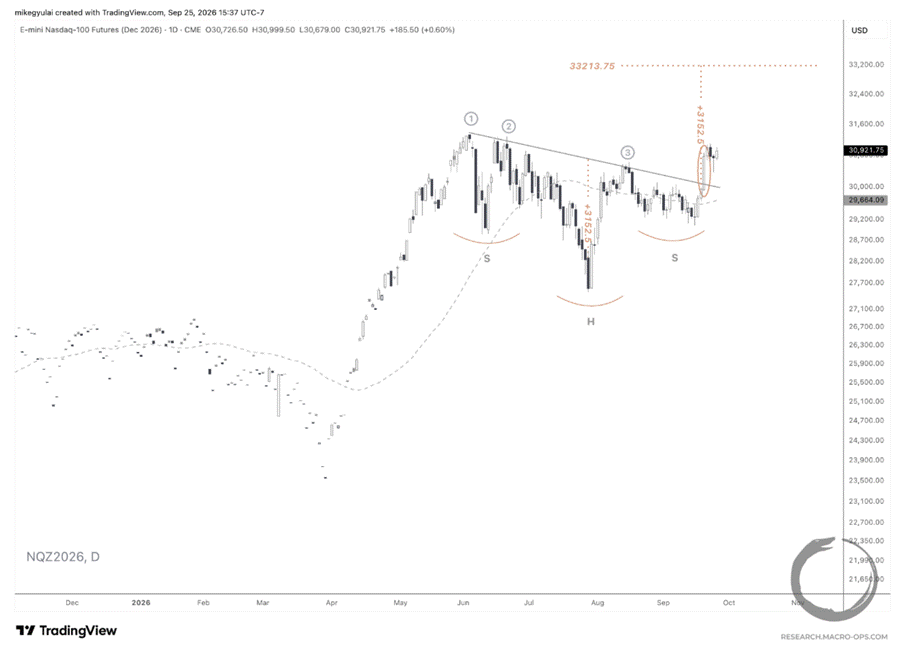
Summary: The evidence still points to the pain trade being higher, but risks and trend fragility have increased…. The Qs have broken out of a tight daily compression regime and a larger inverted H&S continuation pattern. But the index is being carried almost entirely by the AI trade. The rest of the market is selling off, breadth is increasingly oversold, and higher yields are the driver. We’re seeing an uptick in the rate of change in HY and Baa spreads, though off a historically tight base, with financial conditions still near multi-year lows. Rates have a lot more transmission work to do before broad equity indices start to care. Our Narrative Pendulum and investor flows say there’s room for sentiment to crowd further into the AI trade, though the trend is becoming more fragile and tenuous…. We walk through a number of setups in the Ags and end with an FX short, plus more…
MO Portfolio & Trades
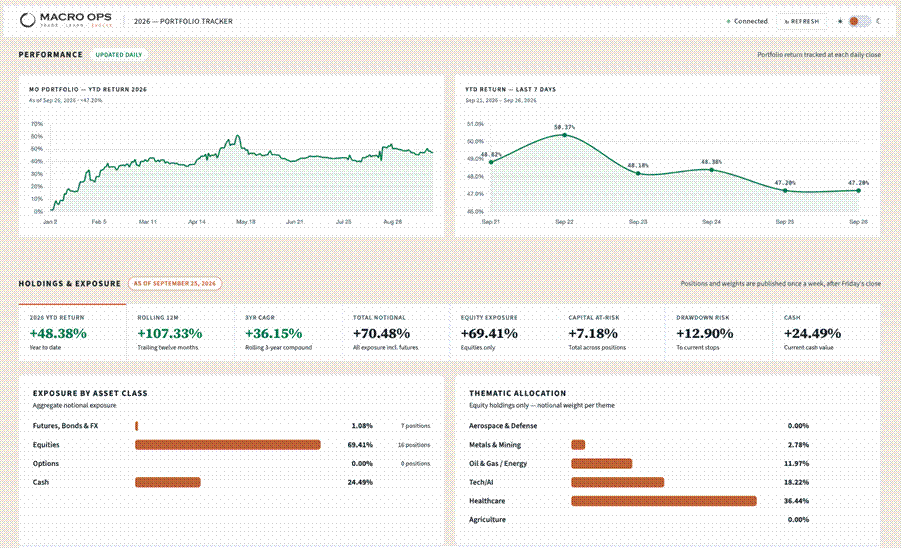
1. The portfolio gained +8bps last week, leaving us +47.20% on the year, below our high-water mark of +61%. We’re long Ags, commodities, miners, and ETHUSD. Long Nasdaq, healthcare, and crypto miners. Short CAD.
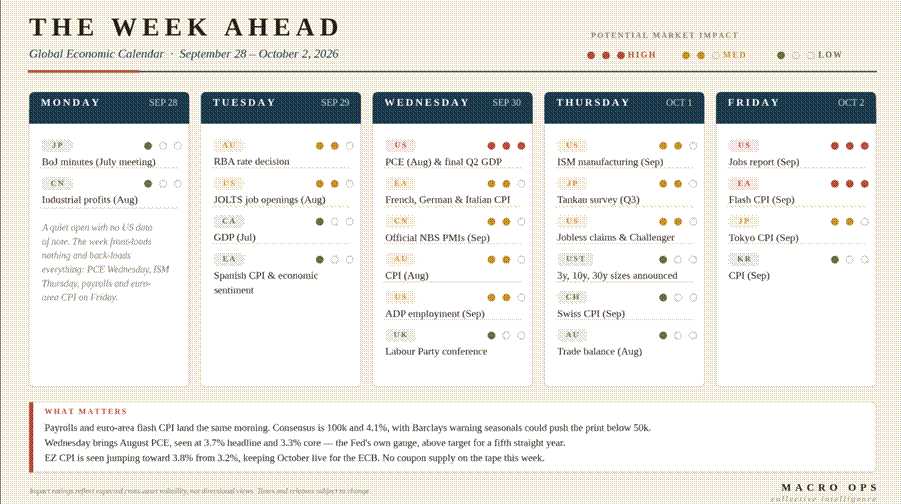
2. The week ahead in data. Payrolls and euro-area flash CPI land the same morning. Consensus is 100k and 4.1%, with Barclays warning seasonals could push the print below 50k. Wednesday brings August PCE at 3.7% headline and 3.3% core — the Fed’s own gauge, above target for a fifth straight year. EZ CPI is seen jumping to 3.8% from 3.2%, which keeps October live for the ECB.
3. As expected, the Qs jumped early last week and have consolidated sideways since. They remain firmly in a primary uptrend and an SQN Bull Quiet regime. The path of least resistance is up.
4. Despite the calm on the surface of the index, breadth has fallen to levels last seen near corrective lows.
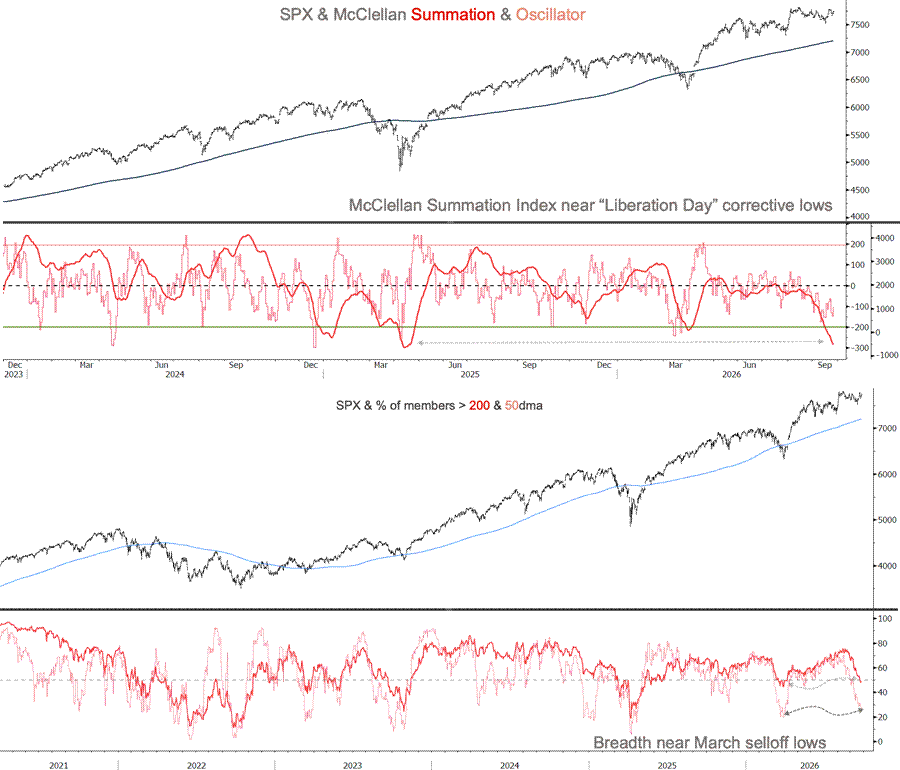
5. My teammate Dean Christians flagged the narrowing rally in his recent report:
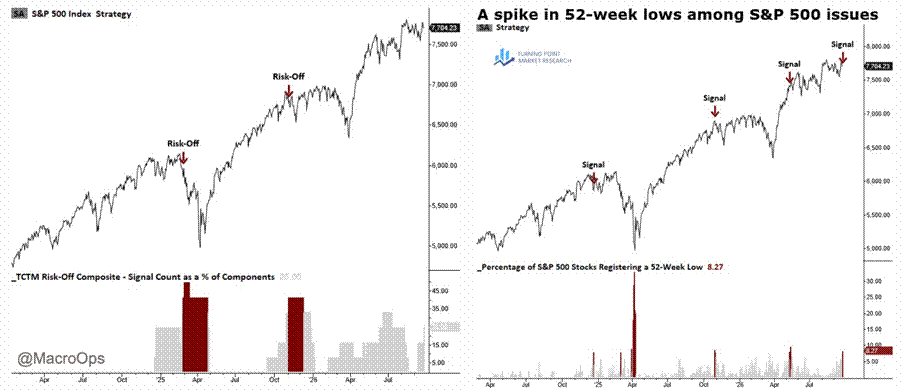
“The cap-weighted index is down only about 1%, but the equal-weighted S&P 500 has declined more than 5%, revealing a much deeper pullback in the average stock. Small caps are under even greater pressure, with the Russell 2000 ETF down roughly 8%, while interest-rate-sensitive utilities have plunged more than 17%.
Yields are the obvious culprit, with the 10-year Treasury jumping a staggering 15 basis points on Wednesday. What started as a selloff concentrated in rate-sensitive groups is now spreading into more areas of the market, and that deterioration is showing up in an expanding number of 52-week lows.
In fact, it was enough to trigger a 52-week low spike signal for S&P 500 stocks, a component of the TCTM Risk-Off Composite. With the new component signal, the TCTM Risk-Off Composite increased to 25%, leaving it two alerts short of a broad model warning.”
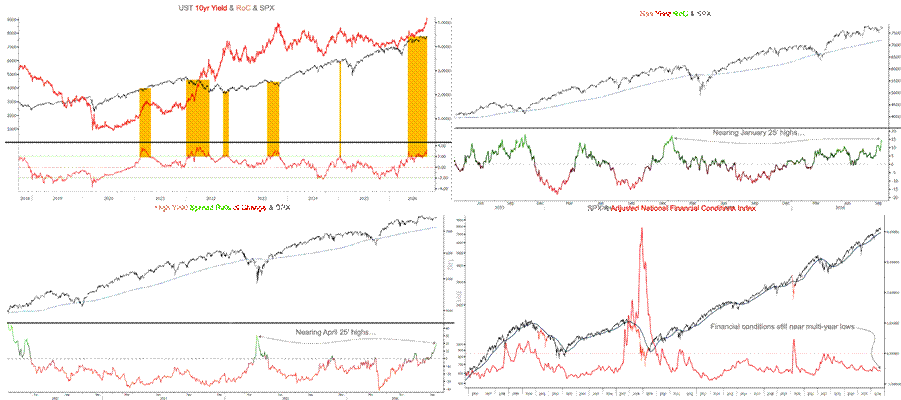
6. Rising yields are a net negative for risk assets. But on their own they’re a condition, not a catalyst. It matters why they’re rising — improving growth and earnings expectations, or rising inflation concerns. And the way they hit equities is through tightening financial conditions. The rate of change in HY and Baa spreads is accelerating to 12m+ highs, but it’s moving off historically tight levels. It’ll take a bigger move before that feeds into broader financial conditions, which still sit near multi-year lows as shown in the ANFCI chart below.
7. Which is partly why we’re seeing notes like this one from GS:
“US equities refuse to price any panic (GS panic index closed sub 1 on Friday) despite sentiment at the lows (GS sentiment indicator -0.9 … AAII bear ~50 … 70% of SPX stocks are trading below the 50dma … etc) … other risk barometers, namely bond vol (MOVE) and CDX also registering peak fear (~100th percentile) while VIX trades in the low teens (fully cognizant there was a CDX roll this week).”
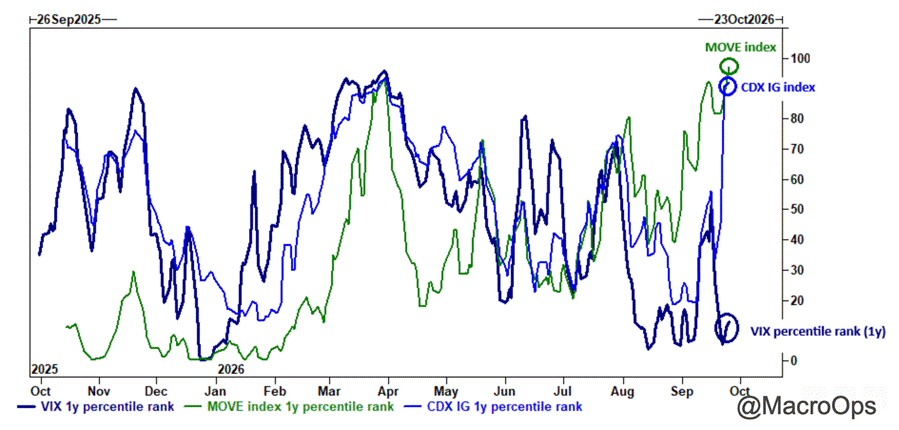
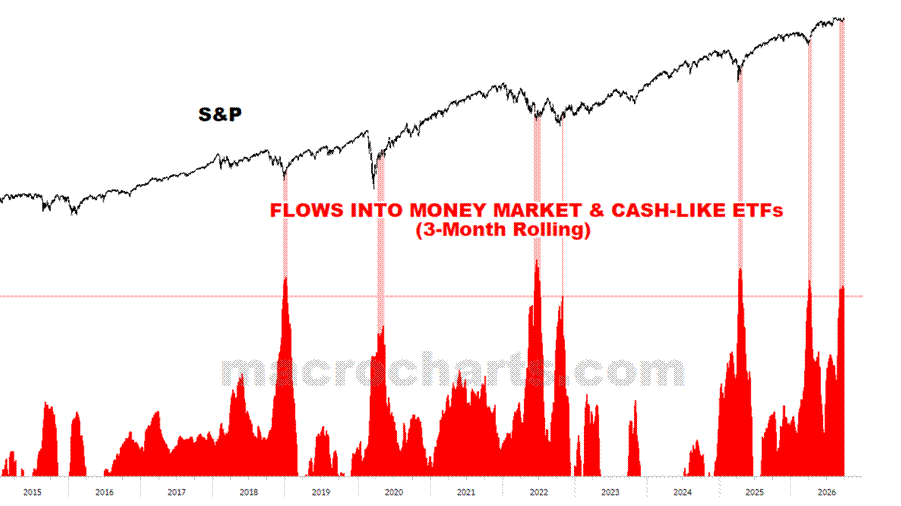
8. That volatility outside the equity indices is keeping investors bearish despite the persistent bull trend in the dominant AI names. The chart below from @MacroCharts is a good example.
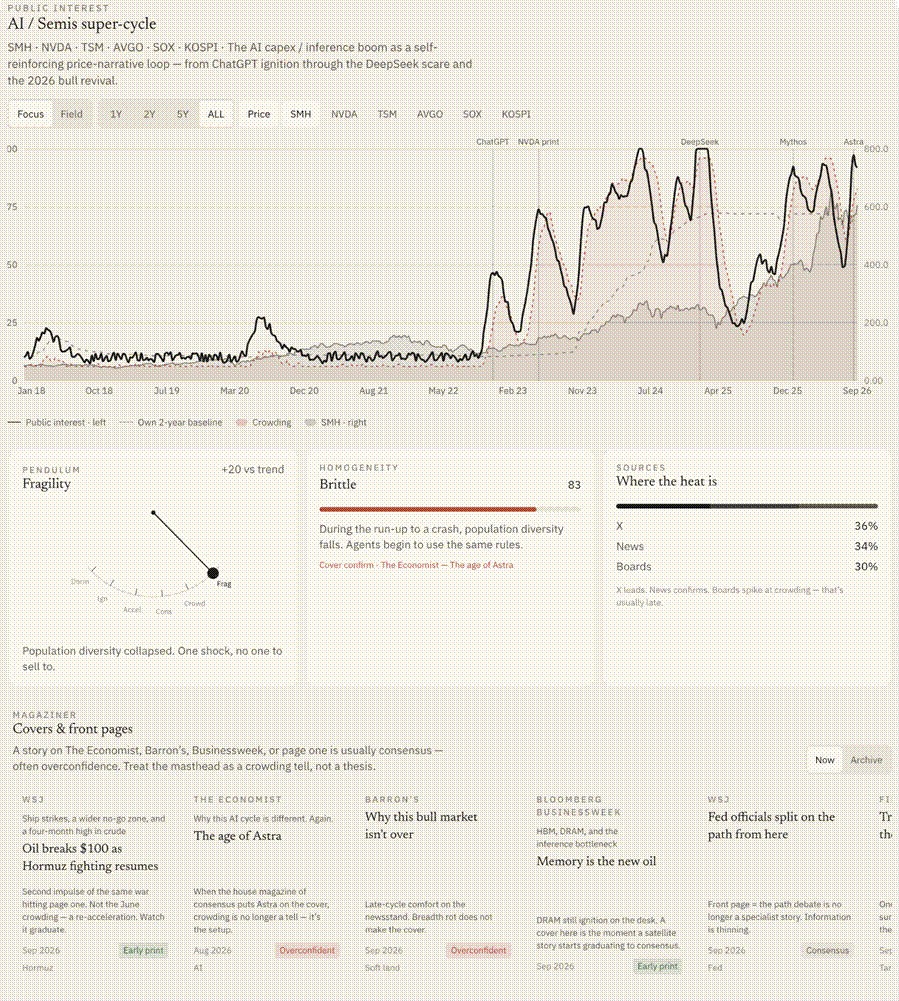
9. I’m watching the Narrative Pendulum closely here, since the market is now entirely reliant on the AI trade propping it up. Public interest (black line) is elevated but still below the “DeepSeek” levels that marked an intermediate top. The shaded red line shows trend homogeneity, which is elevated and rising, though still short of the levels that marked the last three intermediate tops in the AI trade. That backs up my feel: the AI narrative is crowded and increasingly fragile, but it likely has another 1–3 months in it, depending on path and speed, before it hits the consensus levels that mark intermediate to cyclical tops.
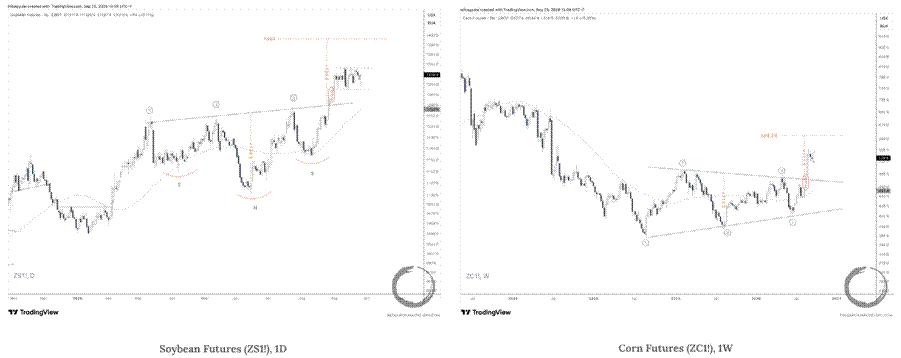
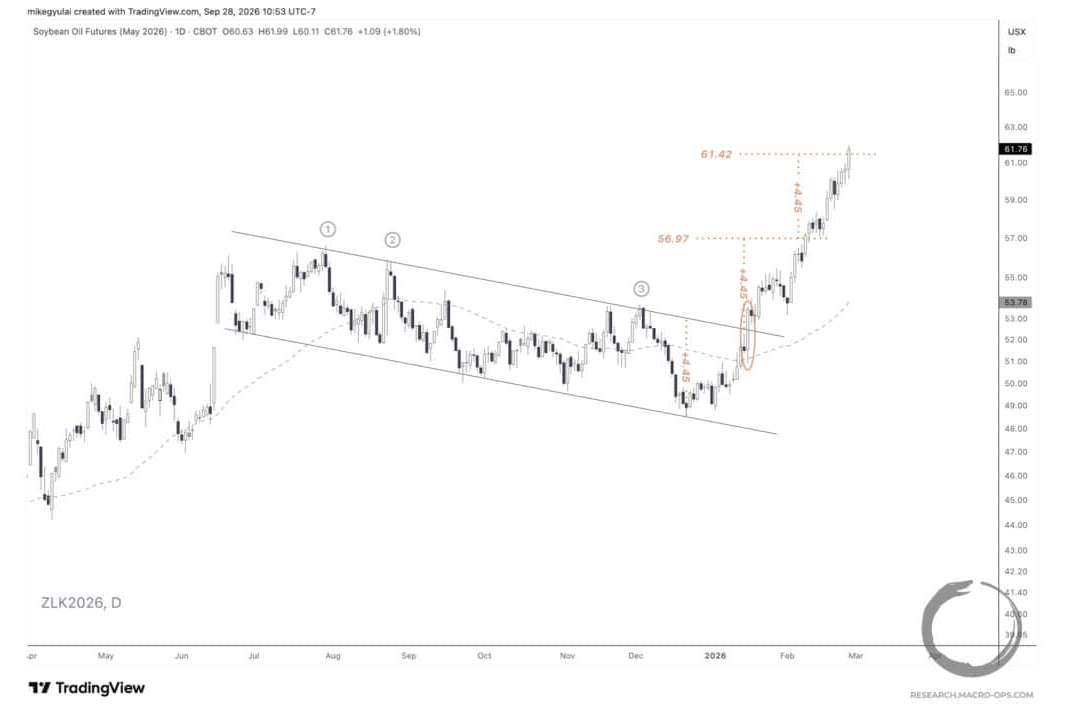
10. My teammate Mike G flagged a series of continuation consolidations in the Ag complex in his recent note (link here). We’ll be working buy stops in this space to see if the market can pull us in long.
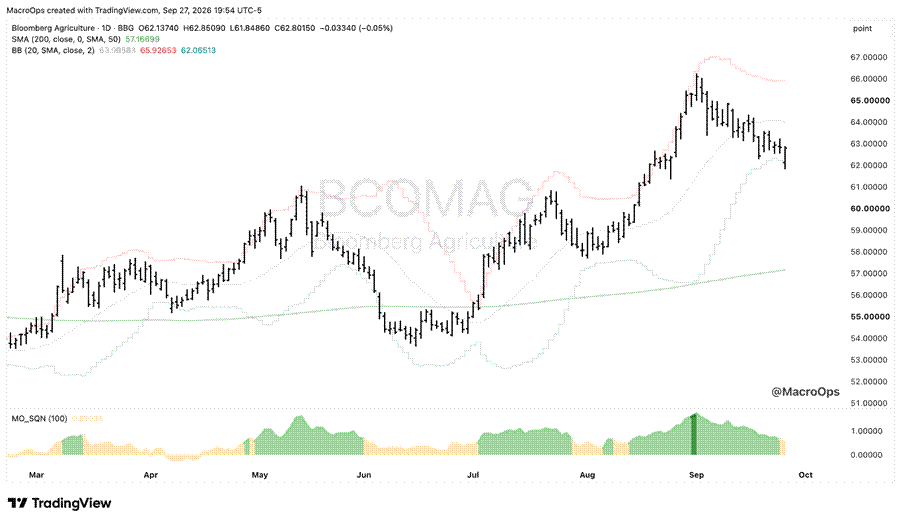
11. The BBG Agriculture index is reversing off its lower Bollinger Band inside a Blended Bull SQN regime. Whether it can hold these levels will tell us a lot.
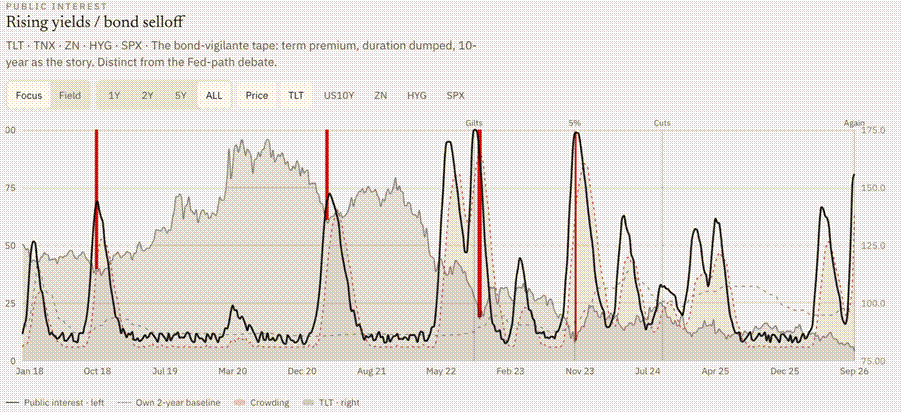
12. Plenty of people are trying to call the bottom in bonds. While we’re closer to an intermediate low than we are to the start of this move, I don’t think this selloff is over. I’m using the narrative tool to see when interest spikes and a consensus forms. The last major lows in bonds were marked by a consensus read in this tool.
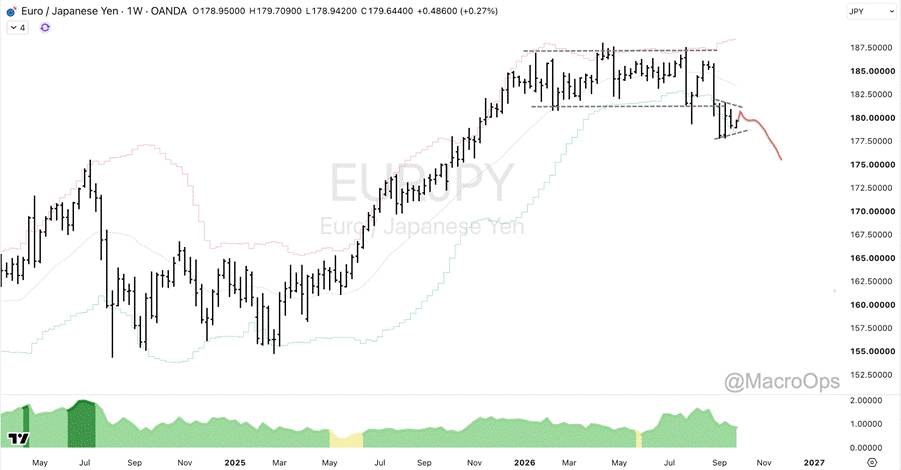
13. I’m tracking EURJPY for a short entry. We missed the first break below its 8-month sideways rectangle, but it’s been compressing on the daily since. We’re working sell stops to see if the pair can pull us in.

Comments
Log in or sign up to join the conversation.